Analyzing the Performance of Your CSP Application
Reveille enables you to get to the bottom of application performance issues across your content platform:
- See performance as your users see it.
- Get ahead of problems in real time.
- Understand and report on customer experience and trends
- Know before users do, react before they are impacted, exceed your service obligations.
You can create a dashboard to:
- Understand response times, peak loading, load patterns and capacity needs at a glance.
- Fix problems immediately with real-time alerts or avoid them altogether with automated remediation.
- Correlate document business transactions with CSP and database message flows to identify bottlenecks and tier-level performance.
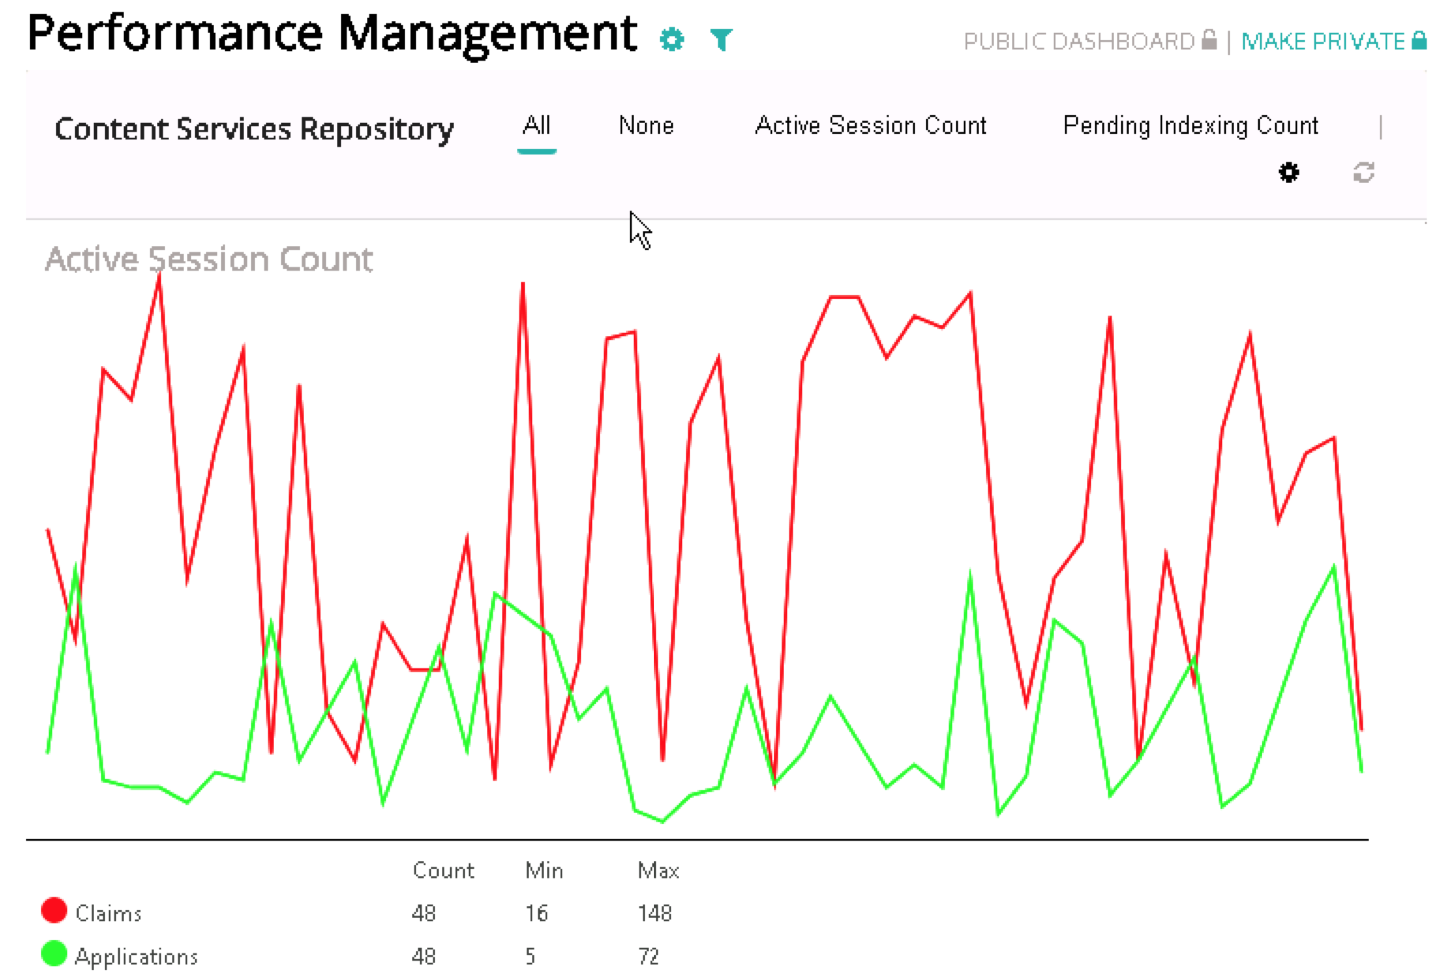
In this example, you want to know how well your content services repository is performing. For this example dashboard, you’ll create one card with two visuals, taking just three basic steps:
- Create a dashboard and one card
- Add the Active Session Count visual
- Add the Application User Count visual
The upper visual will look like this:
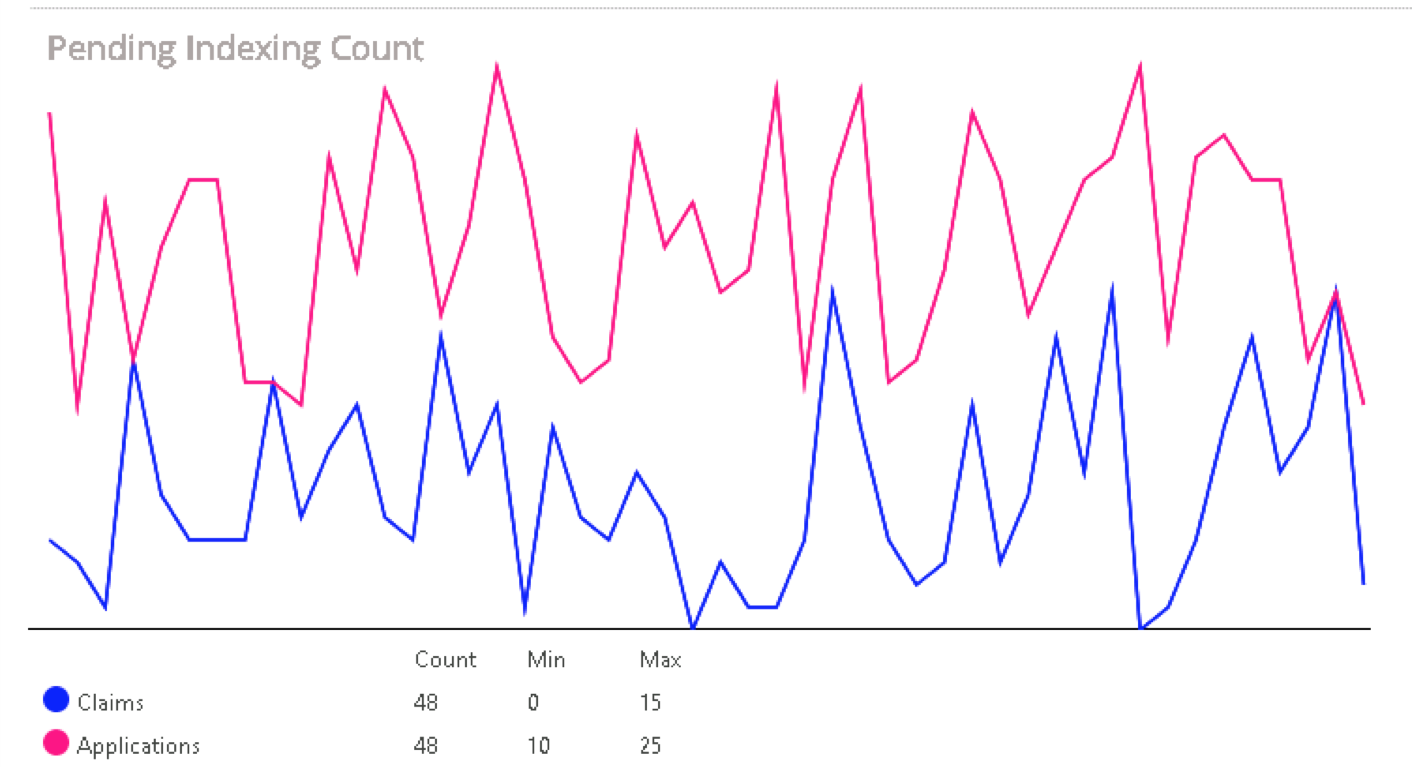
And, here's a view of the lower (second) visual:
Create a dashboard and one card
To create an example performance dashboard:
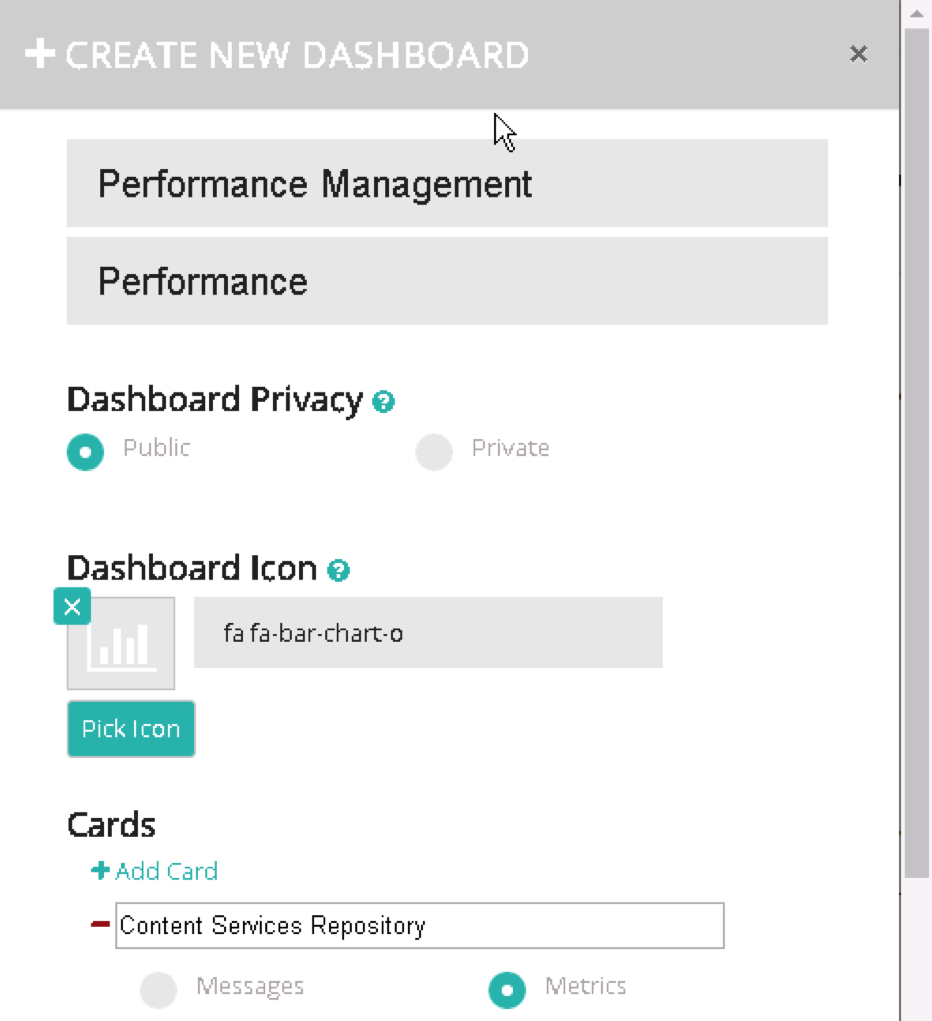
- In the left menu, click Add Dashboard. The Create New Dashboard dialog box opens.
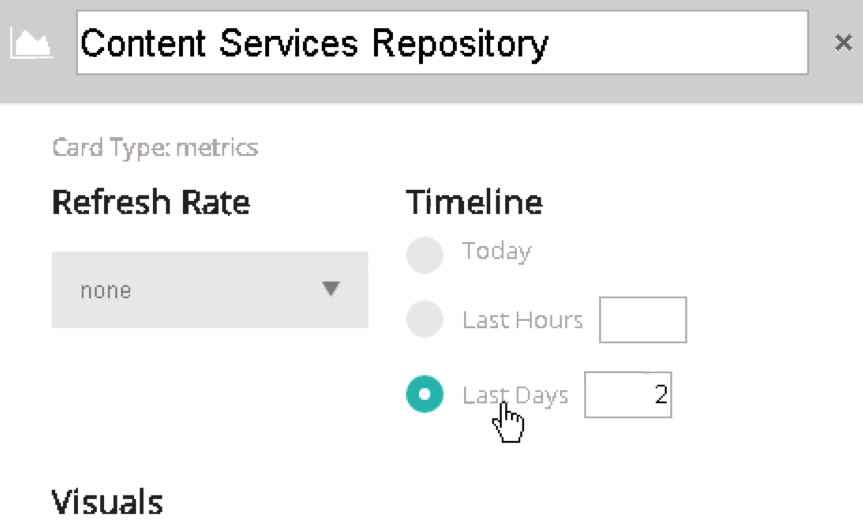
- Configure your dashboard and card as you see in the screen capture below:
- Click Create. Your new dashboard and card appear.
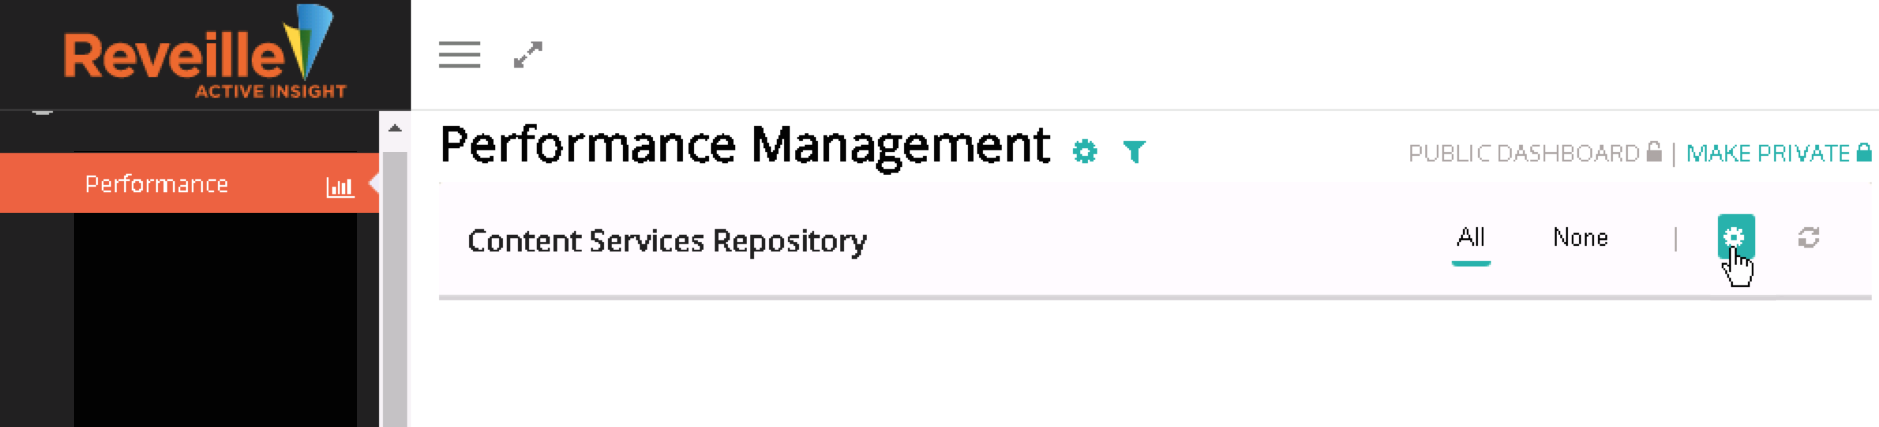
- On the right side of the dashboard, click the gear icon.
- Configure the card as shown in the following screen capture:
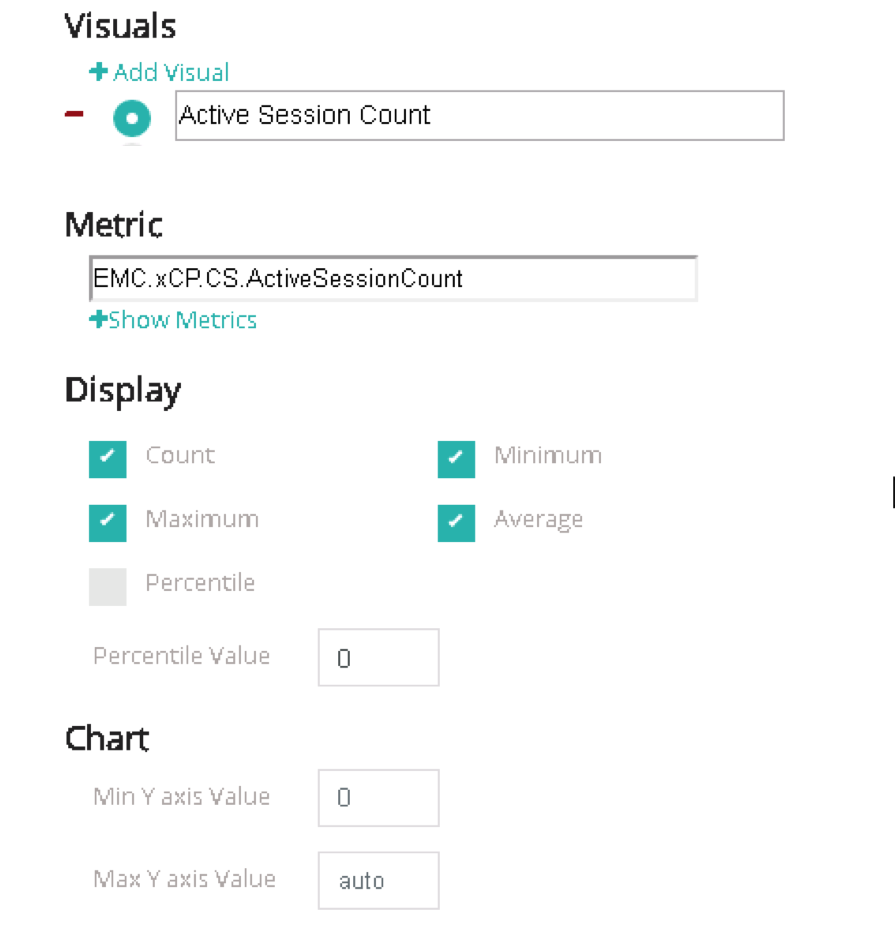
- Click Add visual, then configure the first visual as shown in the next screen capture:
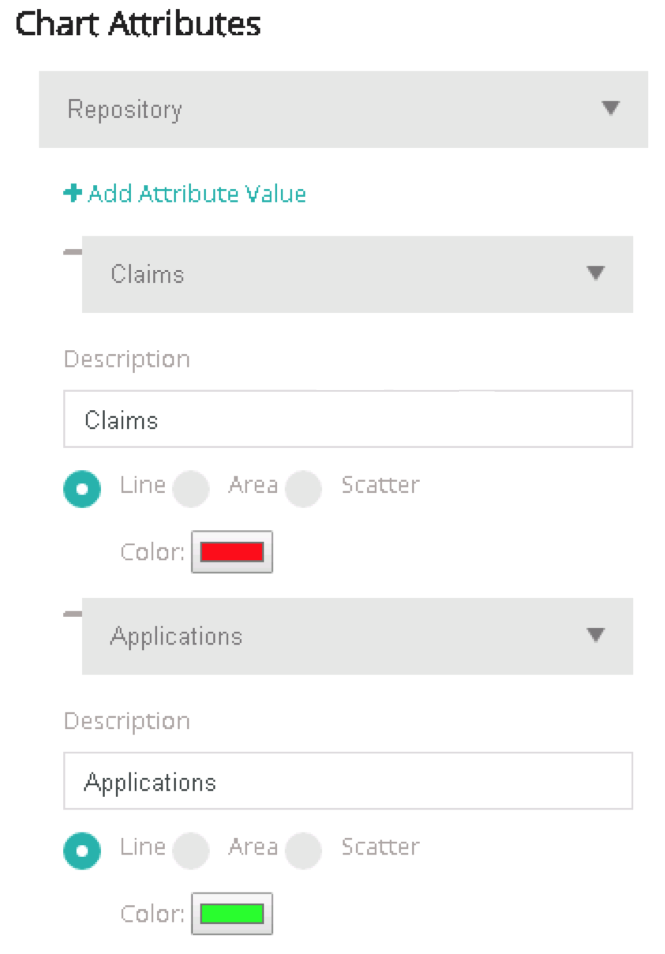
- Under Chart Attributes, choose Repository.
- Click Add Attribute Value, then choose Claims.
- Configure your Claims graph as shown in the next screen capture:
- Click Add Attribute Value again, then choose Applications
- Configure your Applications graph as shown above.
- Scroll down to the bottom of the dialog box and click Save changes. Your new Content Services Repository card displays the Active Session Count visual in your Performance Management dashboard.
- To add the second visual, click the gear icon on the right side of the dashboard. The Content Services Repository card dialog box opens.
- Repeat steps 7-13 with just two changes: name the visual Application User Count and choose this metric: EMC.xCP.xPLORE.PendingCount.
The Content Services Repository card dialog box opens.
Add the Active Session Count visual
Add the Application User Count visual
Was this helpful?
Please tell us why:
Thank you.