Measuring User Adoption of Your CSP Application
If you want to measure the acceptance of a new application and monitor usage patterns, you can create a user adoption dashboard in Reveille. The adoption dashboard offers insights into your return on investment, enabling you to compare how well your new app is doing versus an older one.
In this scenario, your new loan origination application in IBM Content Navigator has just gone live. To get a handle on how many people are using your new app, how they’re using it, and where to look for improvements, you can create an app adoption dashboard in four basic steps:
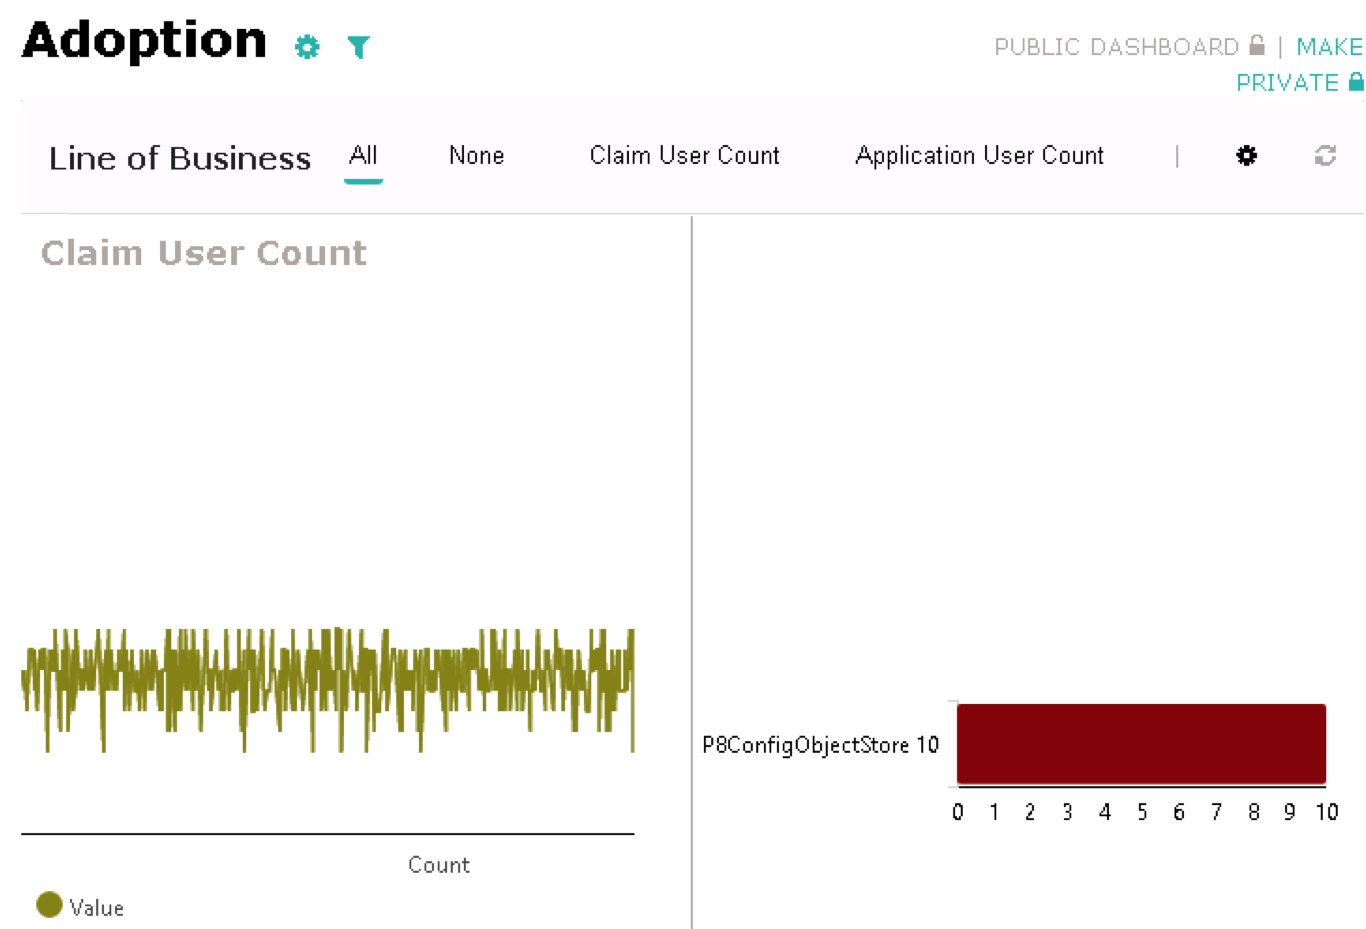
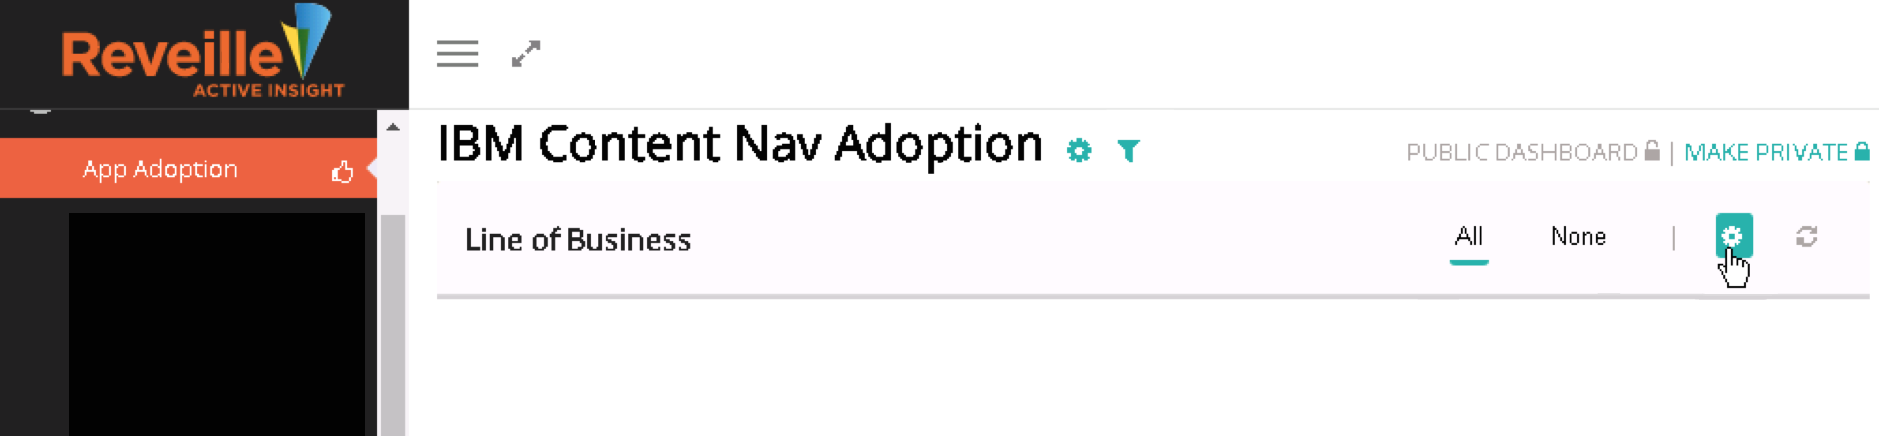
For this example dashboard, your upper visual will look like this:
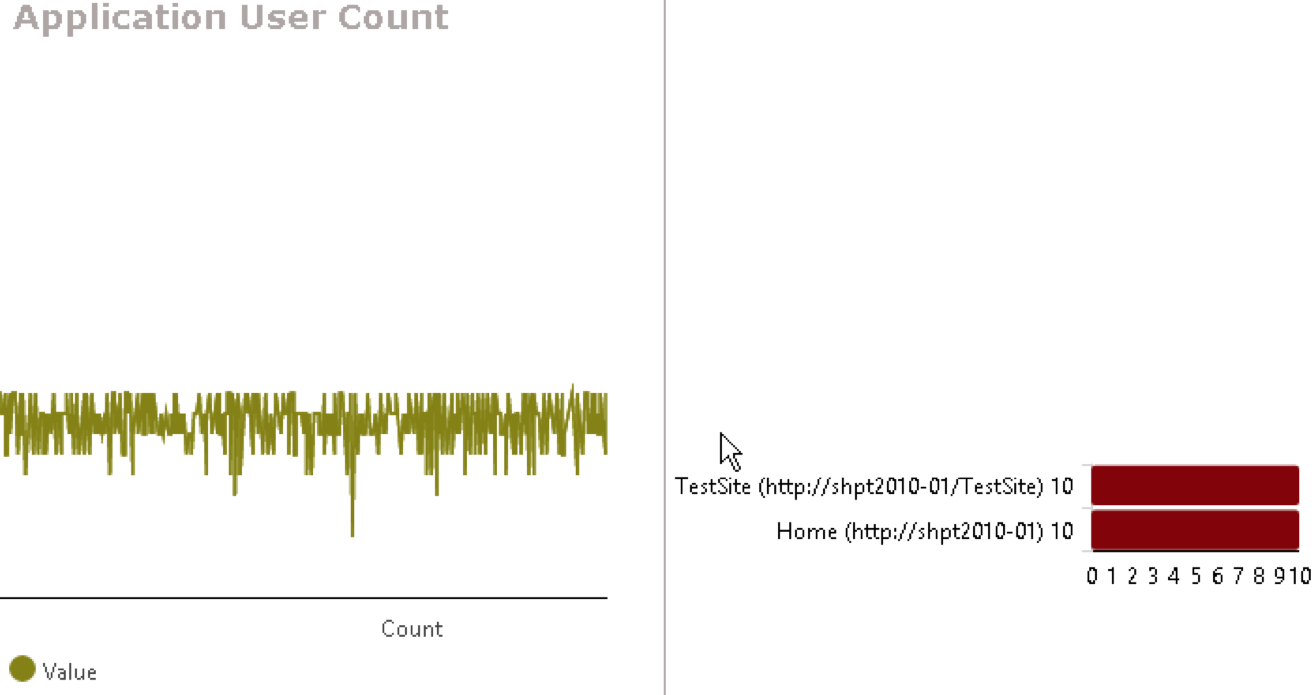
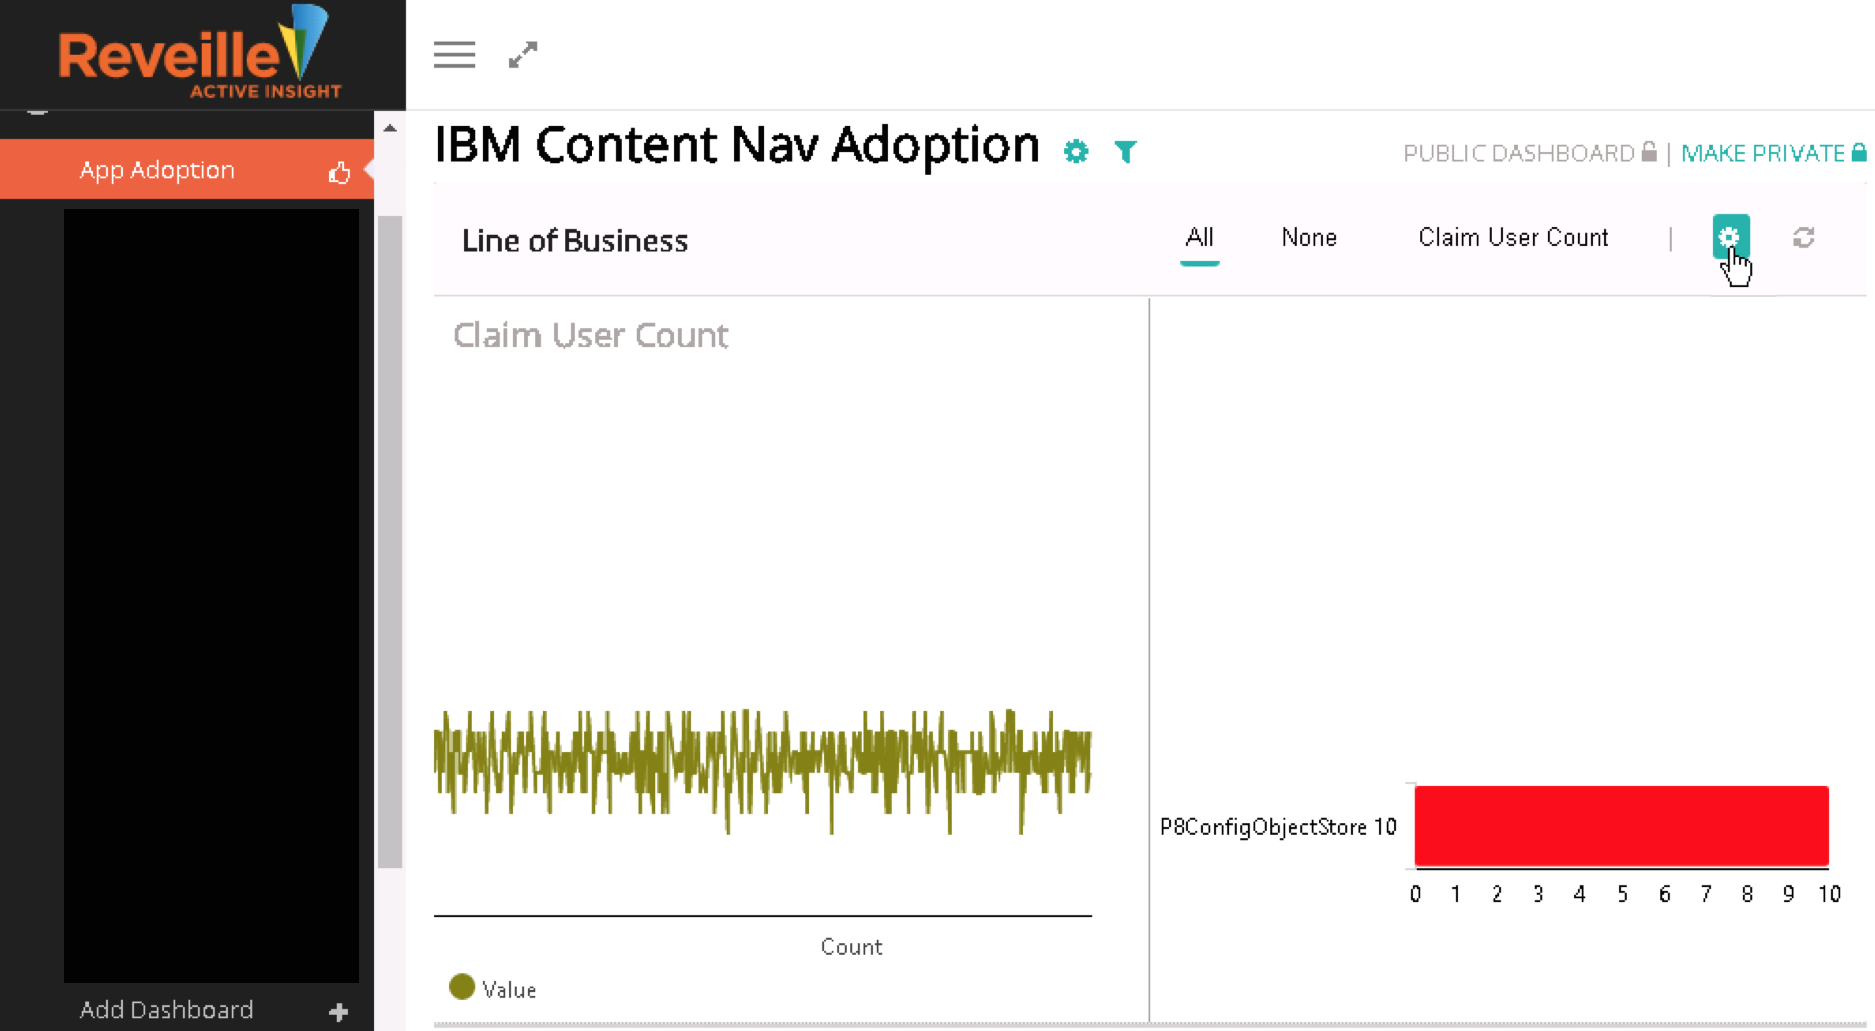
Your lower visual will look like this:
Add a new dashboard:
To create a user adoption dashboard:
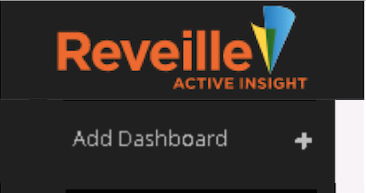
- In the left menu, click Add Dashboard.
-
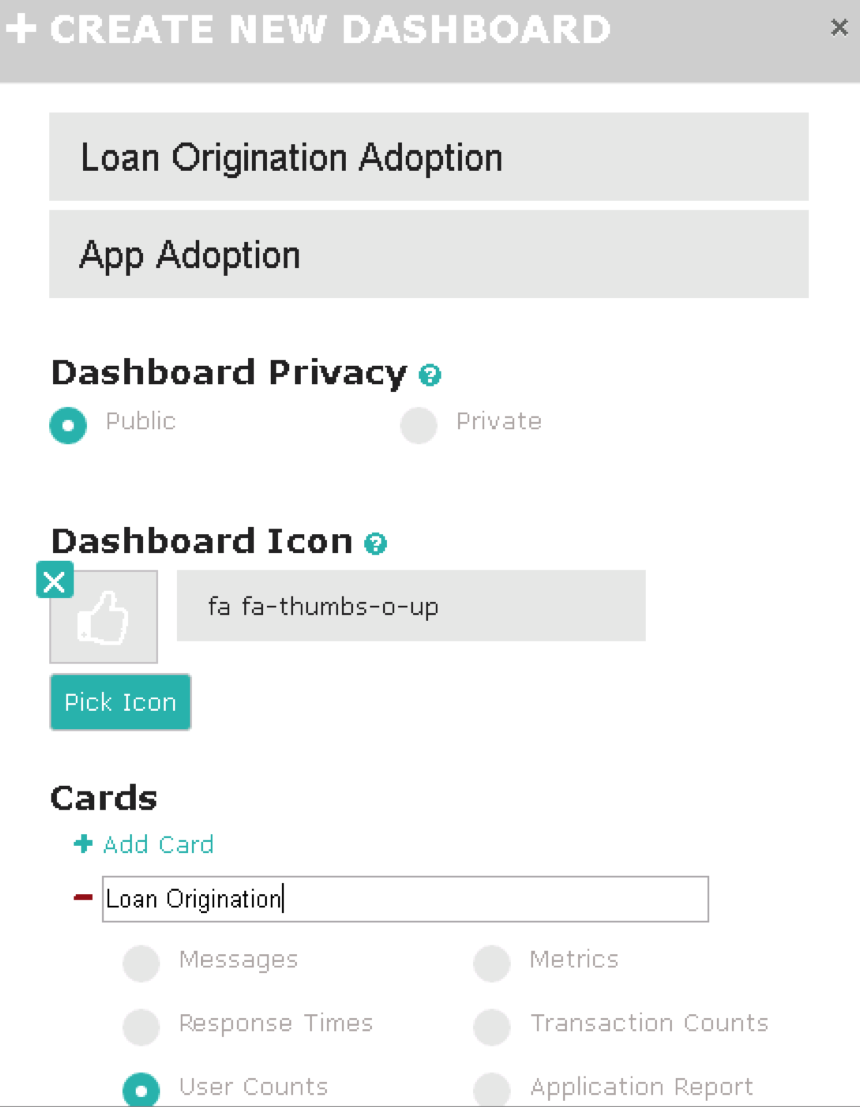
Enter a dashboard Description, such as Loan Origination Adoption.
-
Enter a Menu Name, such as App Adoption.
-
Under Dashboard Privacy, select Public to make the new dashboard available to all users.
-
Pick a Dashboard Icon.
-
Under Cards: Add a card and title it Loan Origination.
-
Select User Counts as the card type.
- Click Create. Your new dashboard and card are displayed.
The Create New Dashboard dialog box opens.
Next, configure the card you created.
Configure the Loan Origination card:
-
On the right side of the dashboard, click the gear icon.
The Loan Origination card dialog box opens.TipCheck to make sure the Card Type is user counts. - Under Refresh Rate, choose none.
- Under Timeline, select Last Hours, then enter 8.
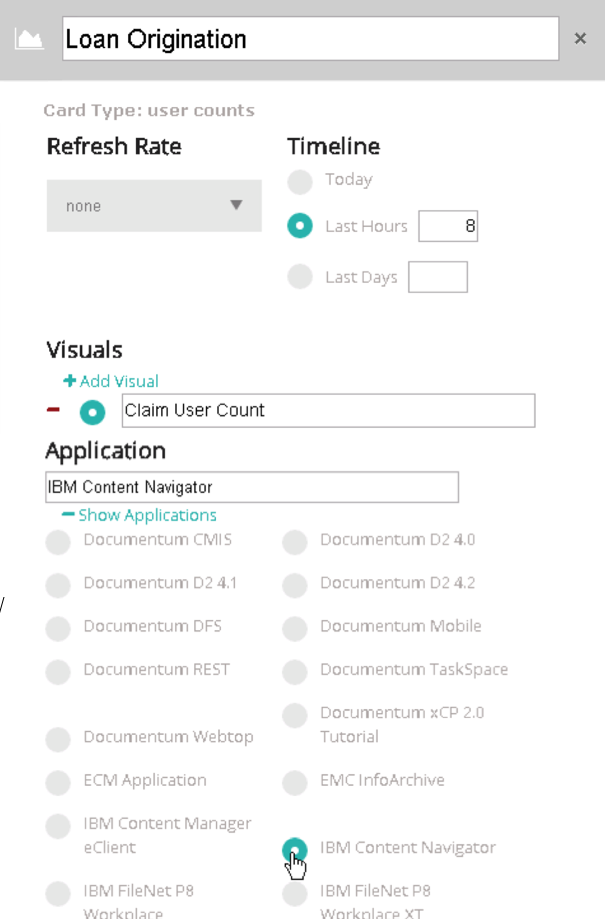
Next, add your first of two visuals for the card.
Add the first (top) visual:
- In the Loan Origination card settings dialog box, under Visuals, click +Add Visual. The dialog box expands.
-
In the first (New Visual title) box, type Claim User Count.
-
Under Application, click +Show Applications. A list of content services applications is displayed.
-
Select IBM Content Navigator to associate an application with the visual you’re creating.
-
Click –Show Applications to collapse the list.
-
Under Transactions, click +Show Transactions. A list of graph types and transactions are displayed.
-
Choose All (transactions), select Line graph, and choose a Color for your graph.
-
Click –Show Transactions to collapse the list.
-
Under Activity Chart, set Max Y axis Value to: 30.
-
Under Counts Barchart, select Show Chart.
-
Choose your Chart Color.
-
Click Save Changes. Your new Loan Origination card displays the Claim User Count visual in your App Adoption dashboard.
Next, you can add a second visual to your card.
Add the second (bottom) visual:
- On the right side of the dashboard, click the gear icon.
- Under Visuals, click +Add Visual. The dialog box expands.
-
In the second (New Visual title) box, type Application User Count.
- Under Application, click +Show Applications. A list of content services applications is displayed.
- Select SharePoint.
- Under Transactions, click +Show Transactions. A list of graph types and transactions are displayed.
-
Choose All (transactions), select Line graph, and choose a Color for your graph.
- Set Max Y axis Value to: 30.
- Under Counts Barchart, select Show Chart.
- Choose a Chart Color.
-
Click Save Changes.
Now, your Loan Origination card displays two visuals in your App Adoption dashboard!
The Loan Origination card dialog box opens.
Was this helpful?
Please tell us why:
Thank you.