Capacity Planning
Whether you’re scaling up or scaling back, intelligent capacity planning offers solid baseline readings and the freedom to experiment with capacity changes in risk-free environment. Using Reveille, you can:
- Measure current capacity needs in real time.
- Set “critical mass” alerts.
- Chart the trajectory of your capacity usage.
- Discover how additional volume will alter your course.
- Learn which users or applications take the most capacity.
- Tweak variables like potential new hires and proposed technology investments to more accurately predict future capacity thresholds.
Reveille enables you to measure platform service levels, establish a good baseline, and look at the resource consumption required to deliver service level. You can also measure user counts and transaction levels, comparing
In this scenario, you want to know how well your current CSPcontent services platform resources are handling user requests. To understand the usage trends for your application, you can create an capacity planning dashboard in three basic steps:
- Add a Capacity dashboard with two cards
- Add a visual to the transactions card
- Add a visual to the application server card
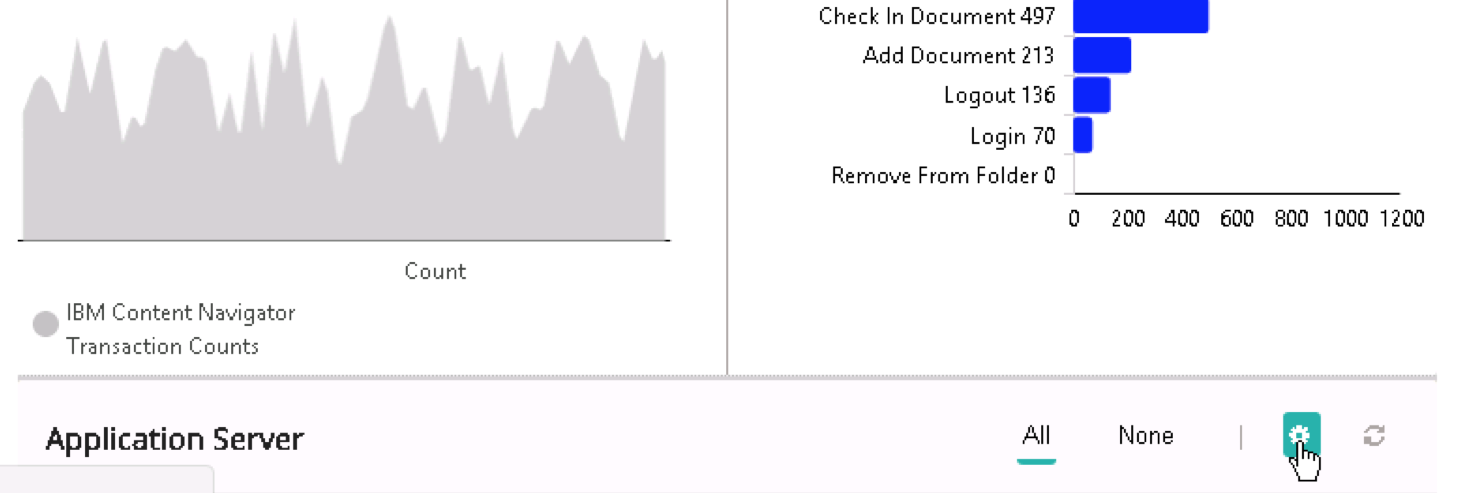
For this example dashboard, your upper card will look like this: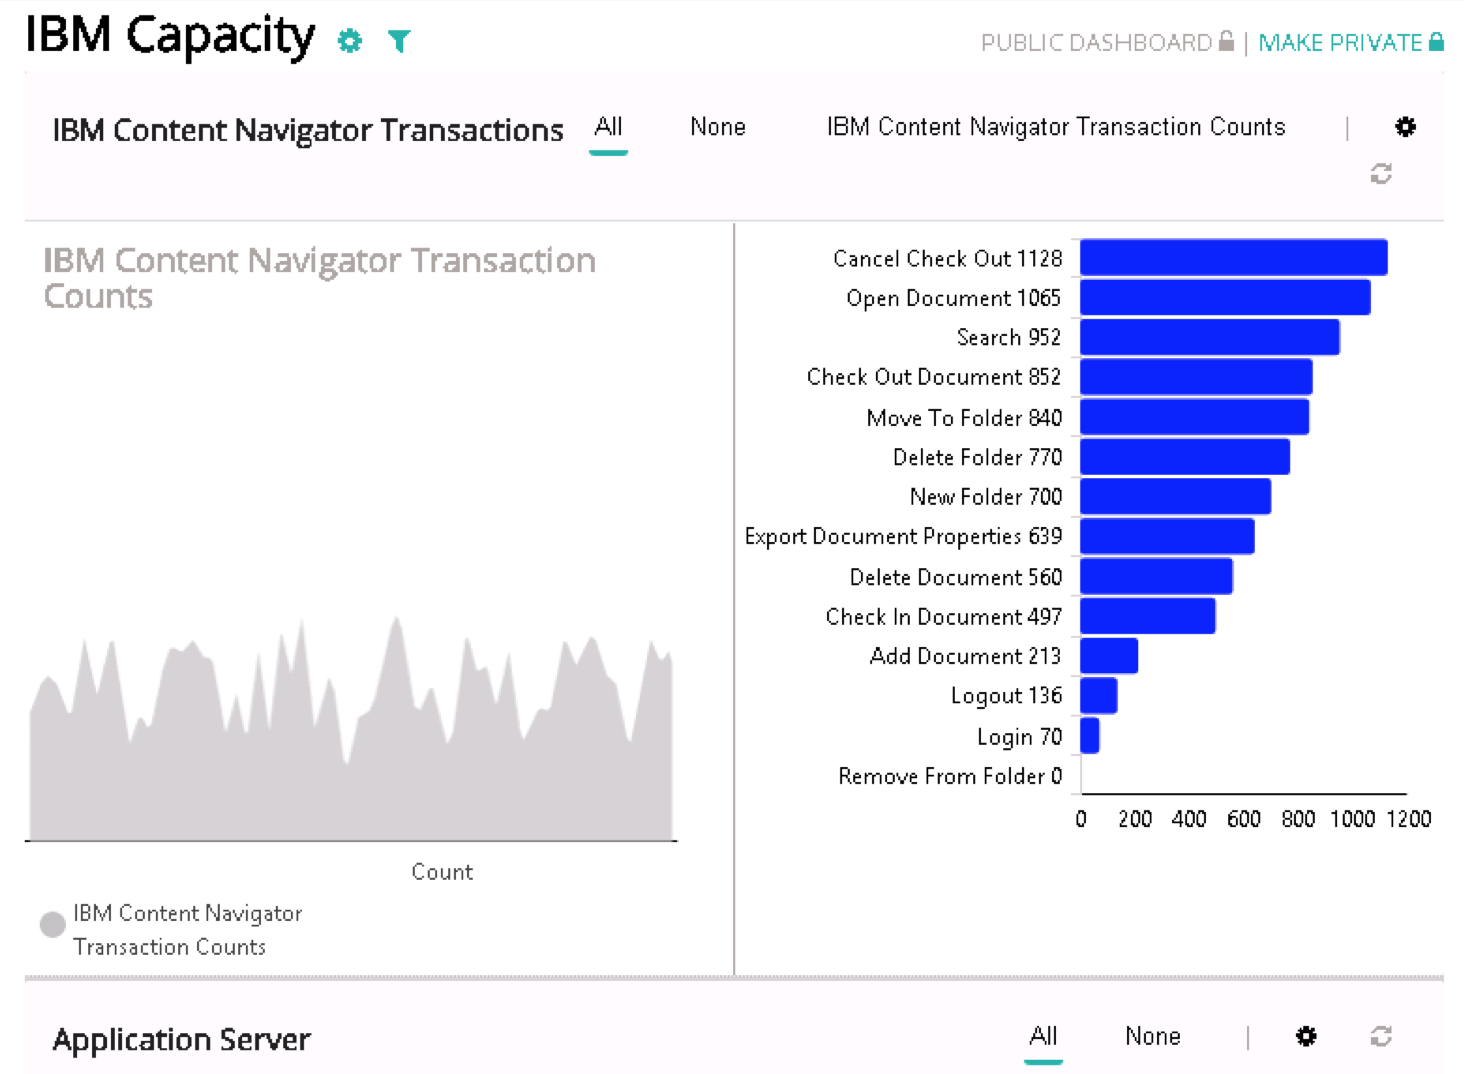
The lower card will look like this: 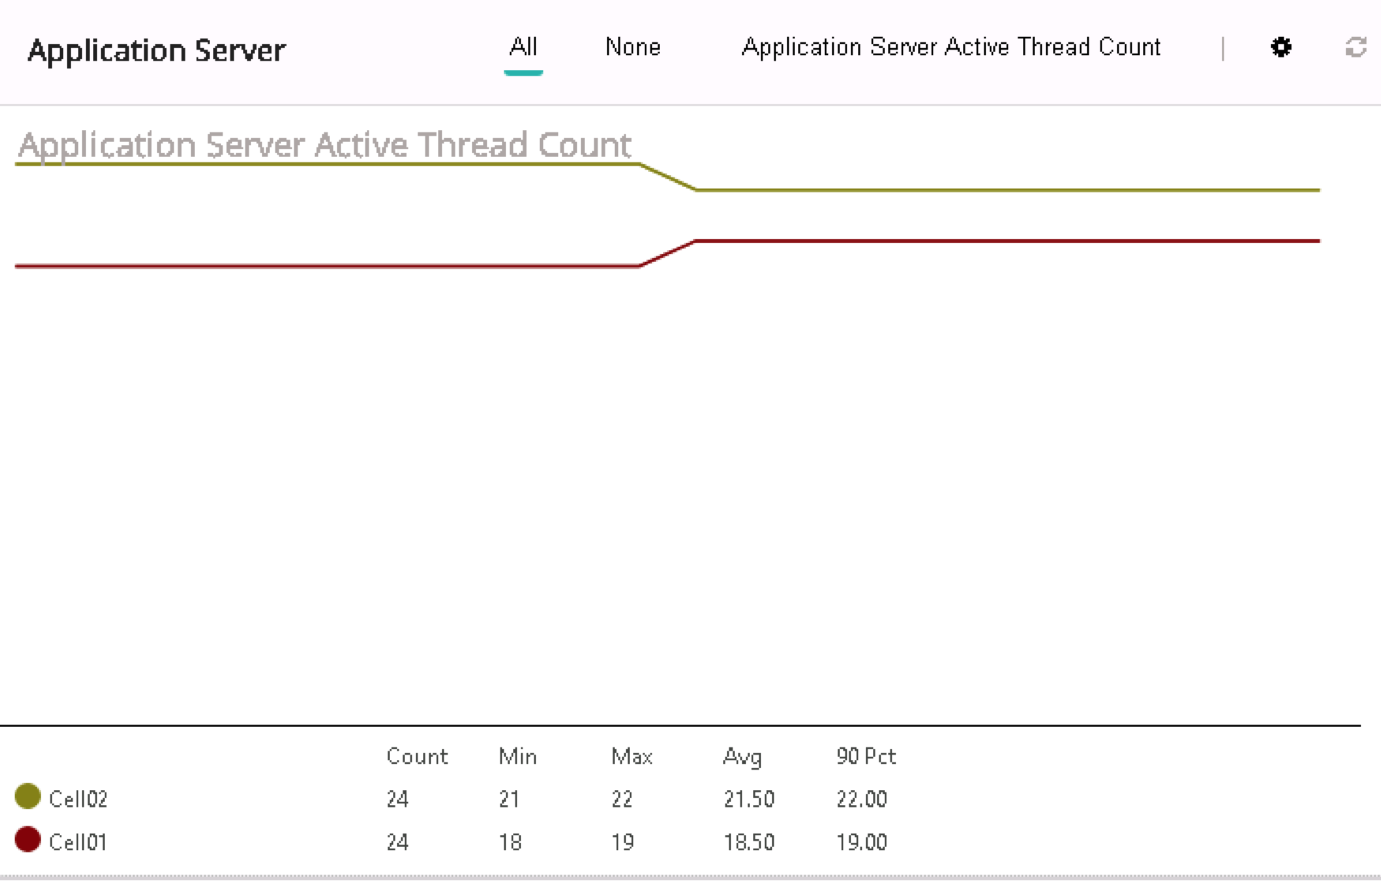
Add a Capacity dashboard with two cards
To create a capacity planning dashboard:
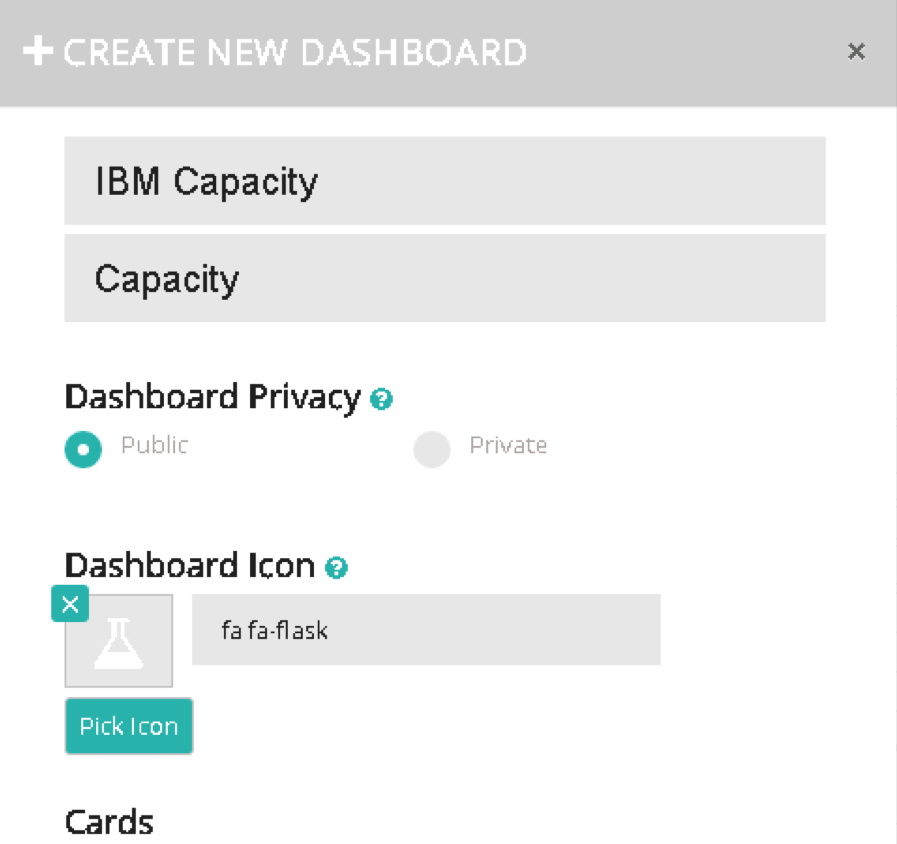
- In the left menu, click Add Dashboard. The Create New Dashboard dialog box opens.
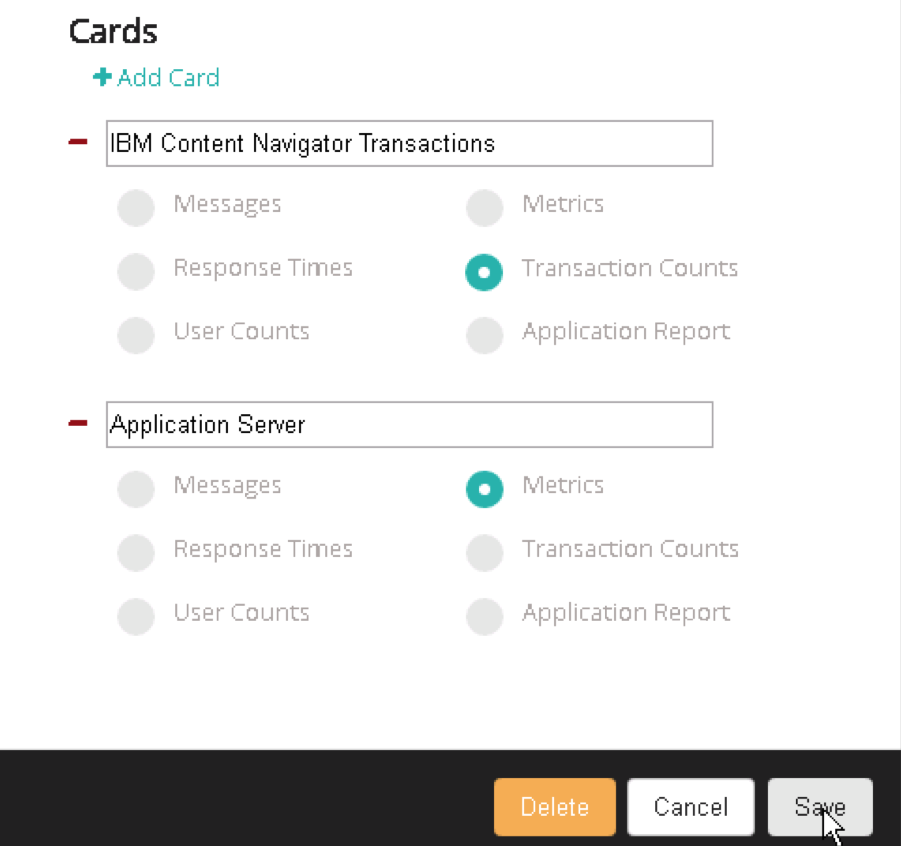
- Configure your dashboard and two cards as shown in the following screen captures:
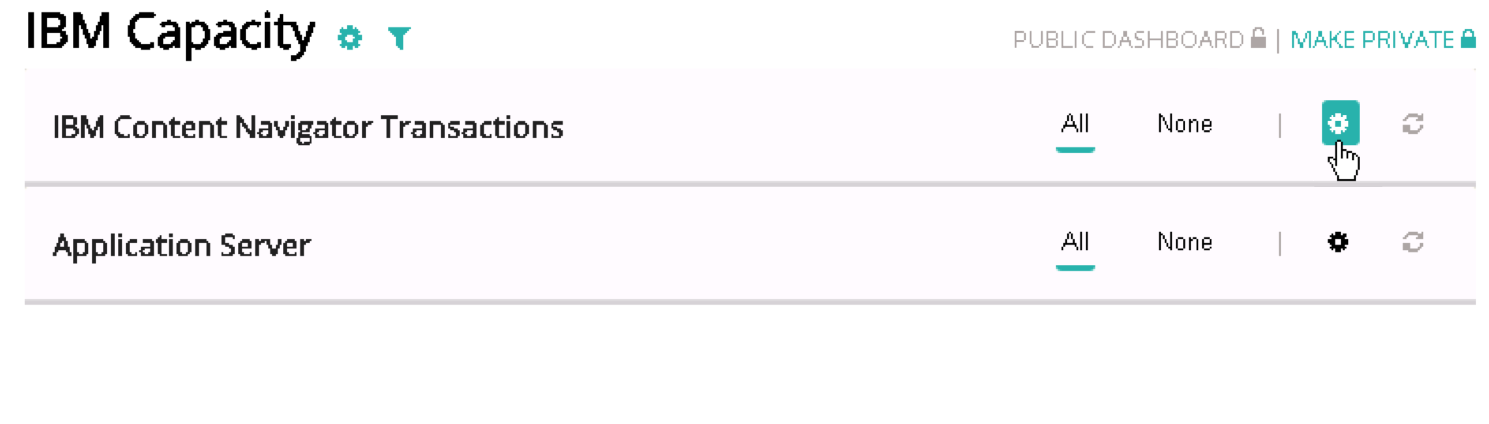
- Click Save. The new dashboard and both cards are displayed.
-
On the right side of the dashboard, click the gear icon in the transactions card. The IBM Content Navigator Transactions card dialog box opens:
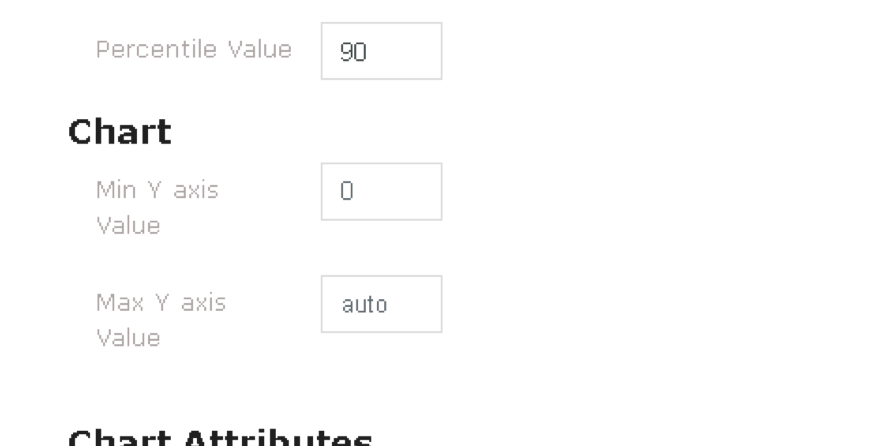
- Add a visual and configure it as shown in the following screen captures:
- Scroll down and click Save changes. Your new transaction count visual is displayed.
-
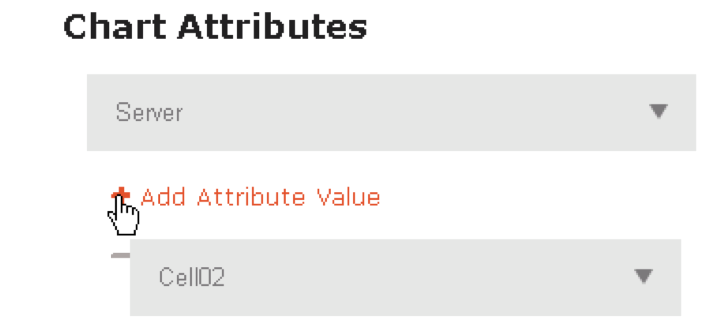
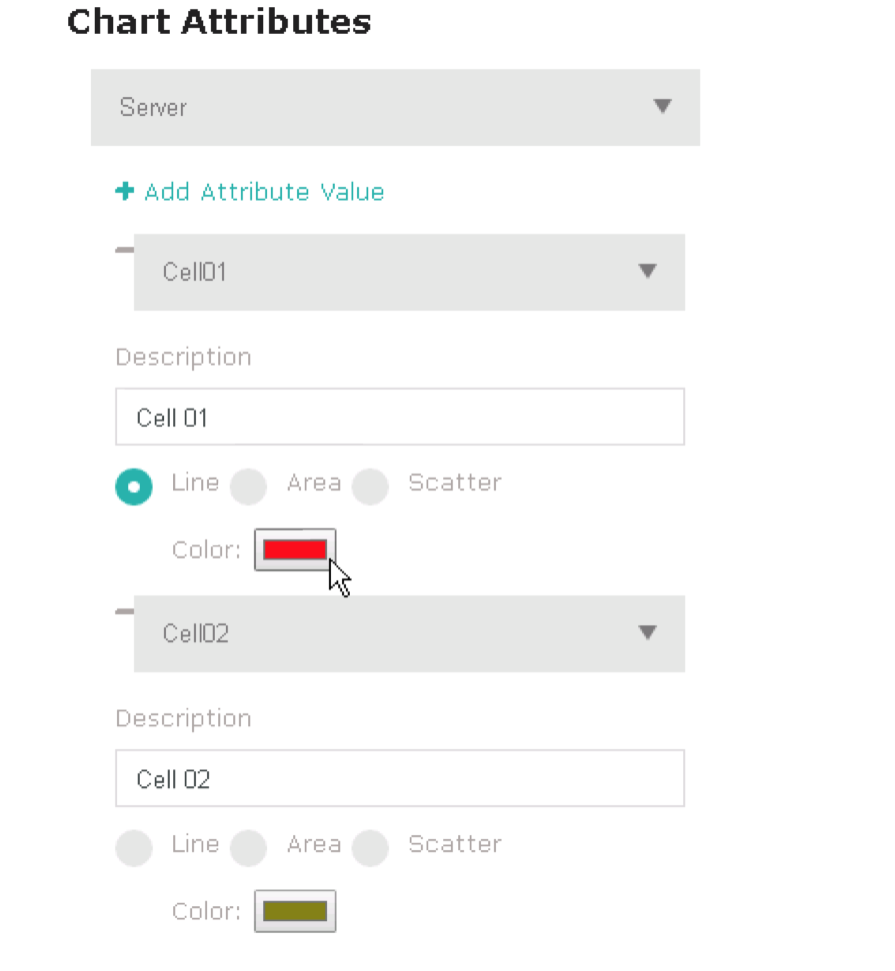
On the right side of the dashboard, click the gear icon in the application server card.
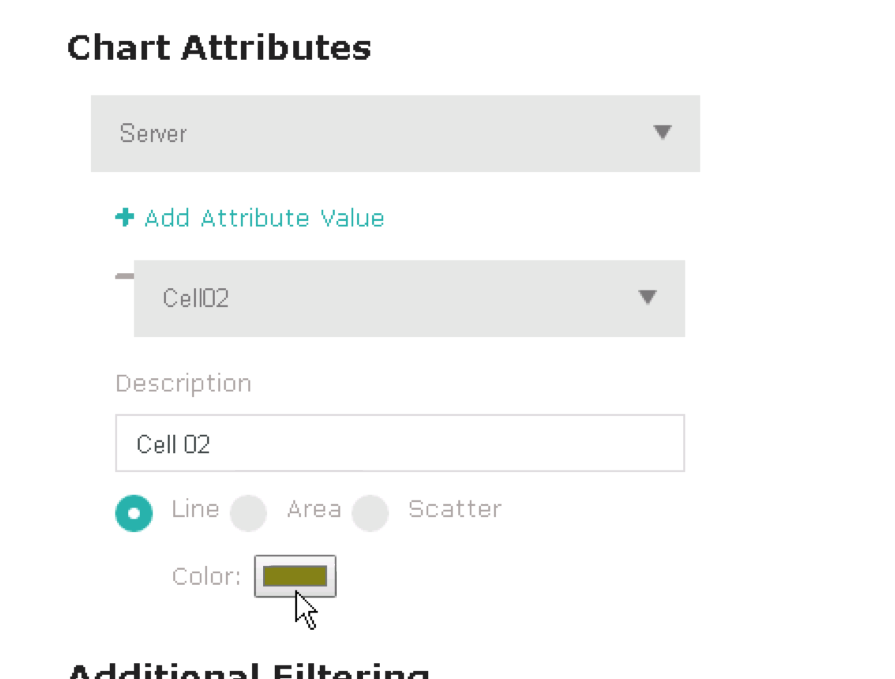
The IBM Content Navigator Transactions card dialog box opens. - Add a visual and configure it as shown in the following screen captures:
- Scroll down and click Save changes. Your new dashboard is displayed, showing two cards and two visuals.
Add a visual to the transactions card
![]()
![]()
![]()
![]()
Add a visual to the application server card

Was this helpful?
Please tell us why:
Thank you.