Capture Processing
Among the many CSPcontent services platform systems you can monitor and analyze, Reveille also enables you to understand capture batch processing performance. Indeed, you can create a dashboard that tracks batch levels, batch exceptions, and batch processing service levels for different business processes.
In this scenario, your capture application has just gone live. To understand how well the system is processing document batches, you can create a capture processing dashboard in four basic steps:
- Add a new Capture Processing dashboard and create a card
- Add the first (Batch Errors) visual to your card
- Add the second (Batch Levels) visual to your card
- Add the third (Batch Levels) visual to your card
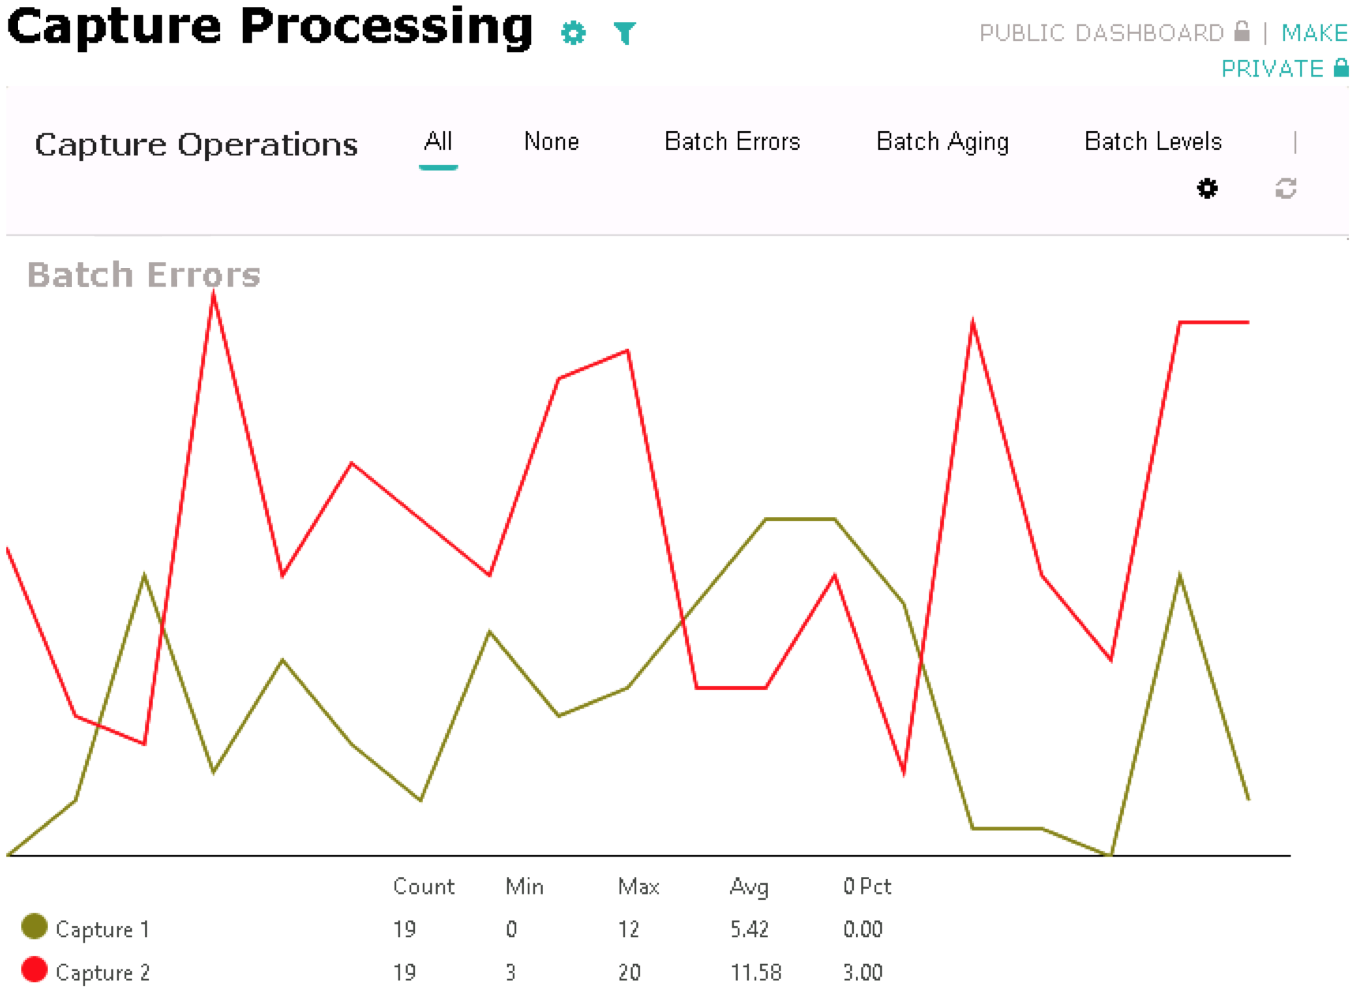
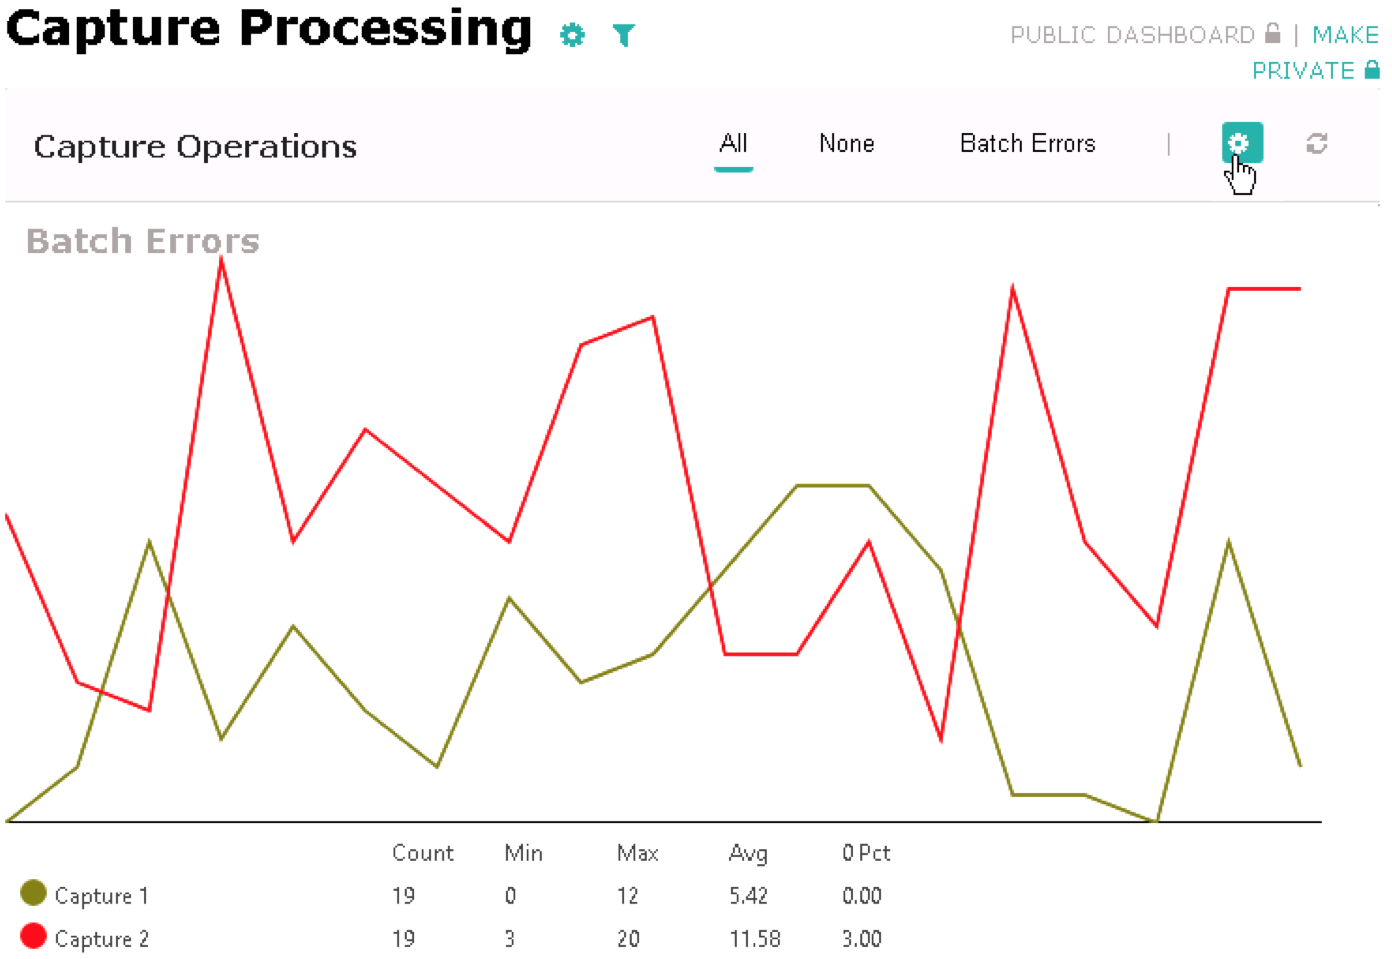
For this example dashboard, your upper visual will look like this:
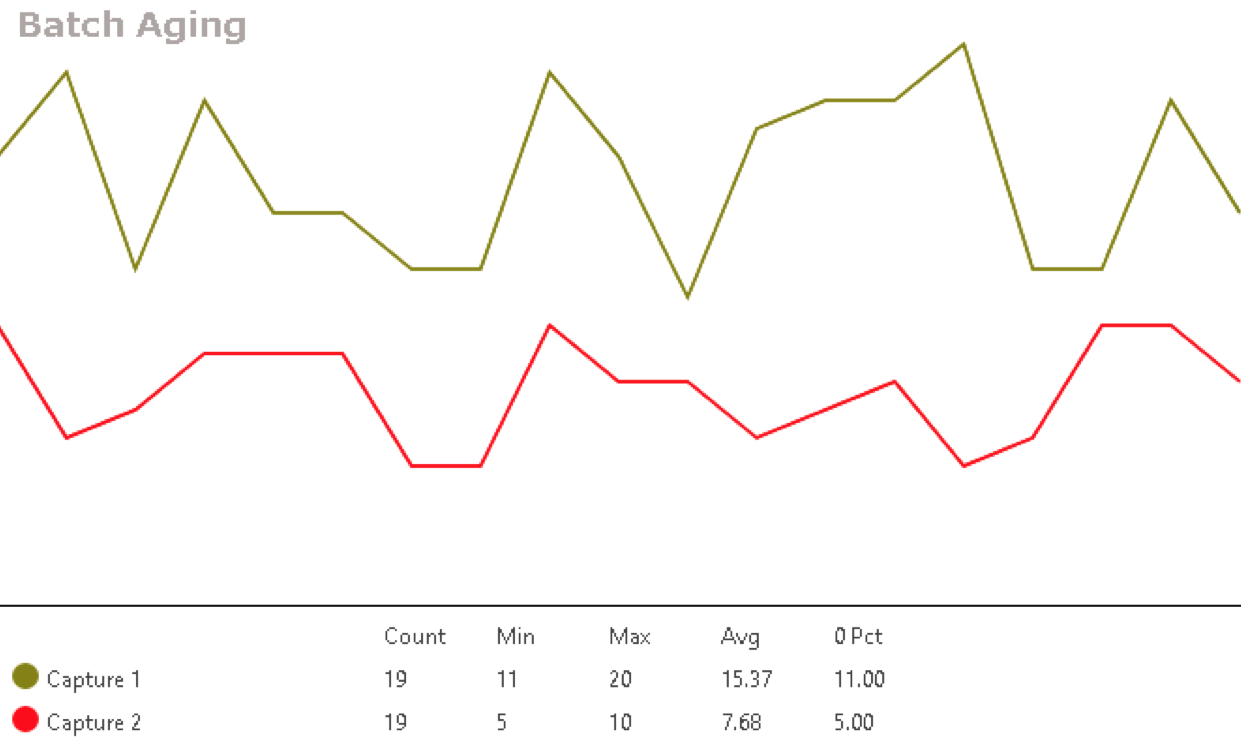
The middle visual will look like this:
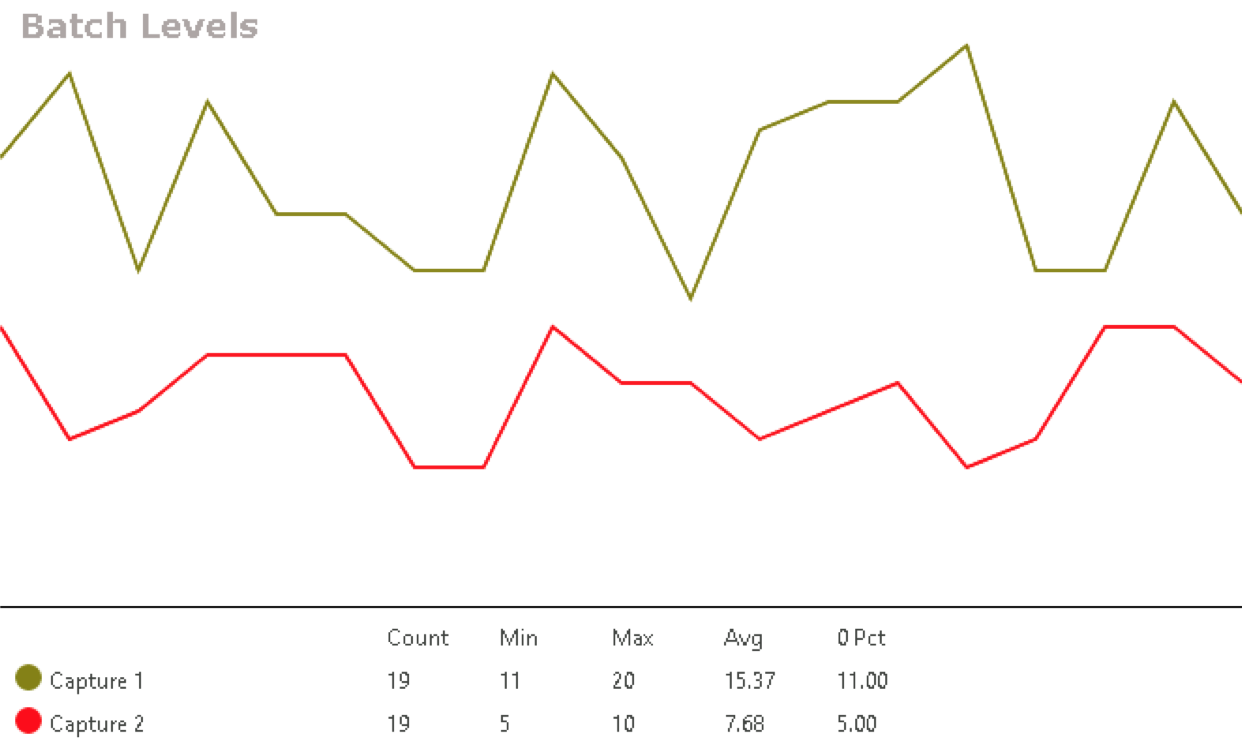
The lower visual will look like this:
Add a new Capture Processing dashboard and create a card
To create a dashboard to help you understand how well the system is capturing and processing documents:
- In the left menu, click Add Dashboard. The Create New Dashboard dialog box opens.
-
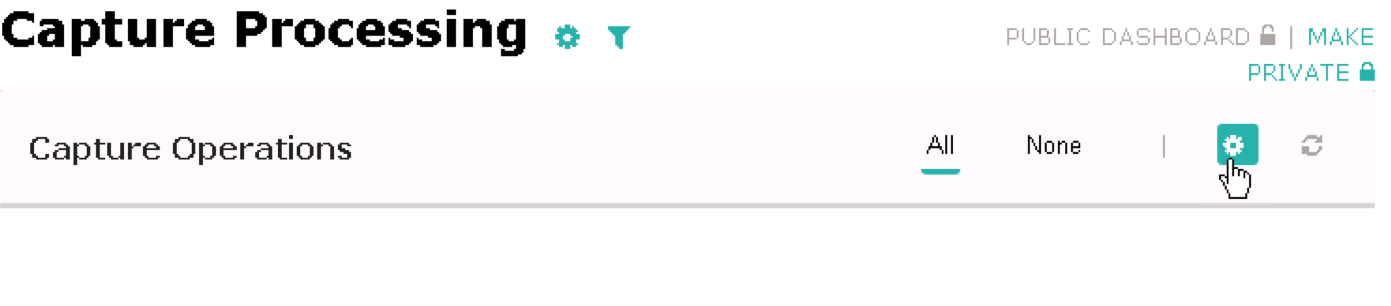
Configure your dashboard and card as shown in the following screen capture:
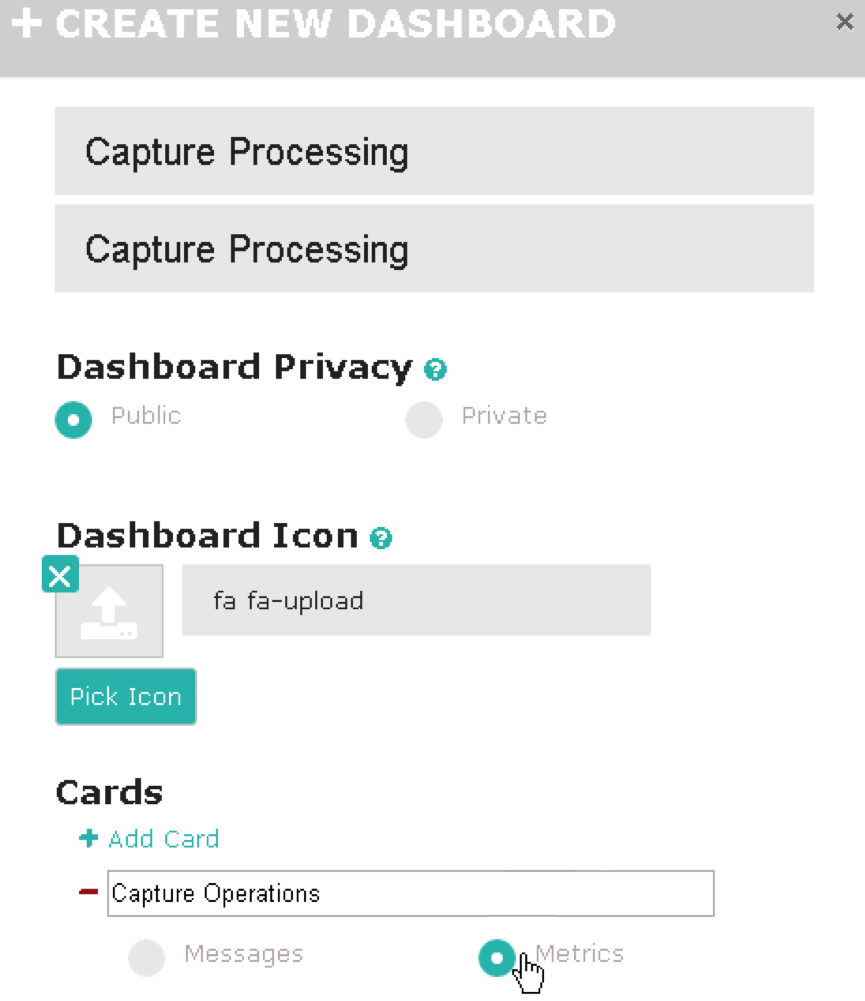
- Click Create. Your new dashboard and card are displayed:
-
On the right side of the dashboard, click the gear icon. The Application Response Time Service Level card dialog box opens
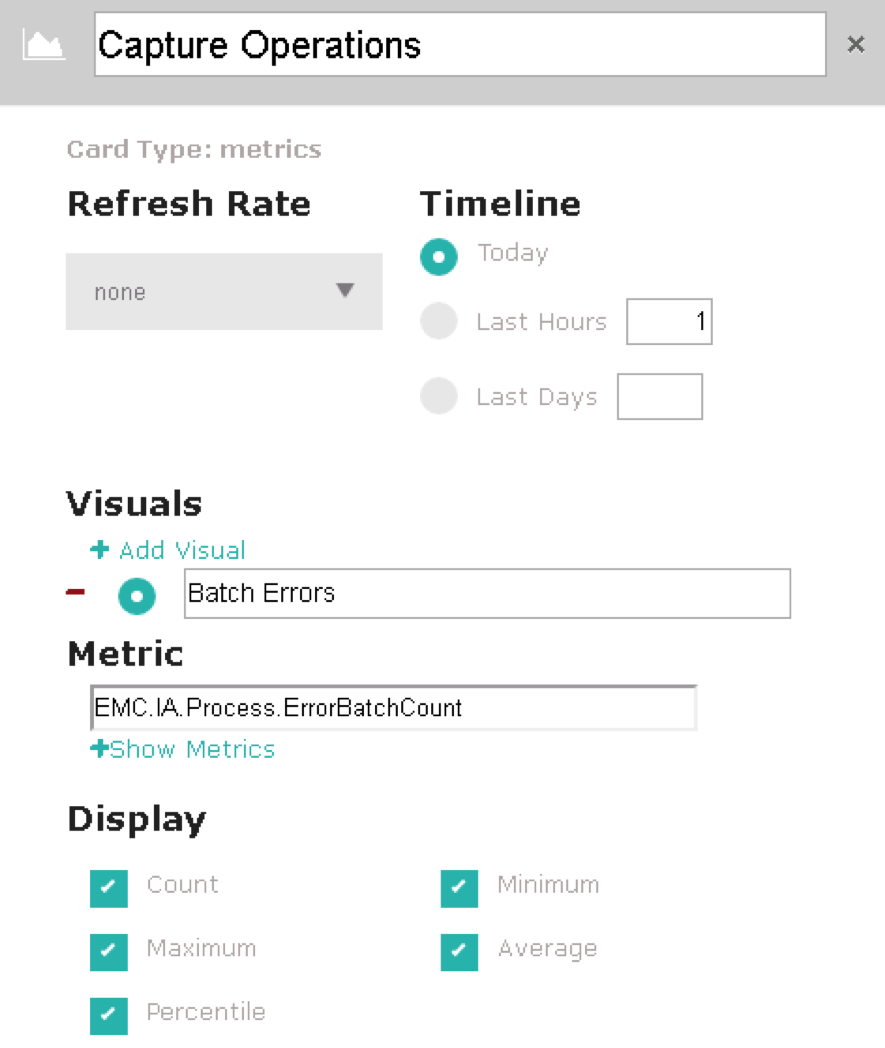
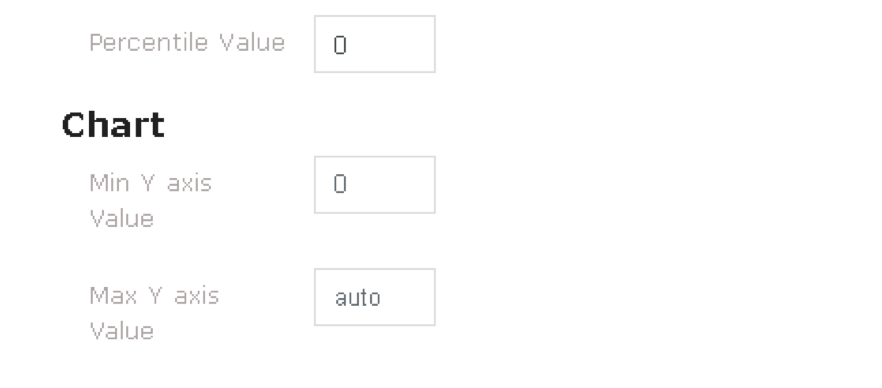
- Configure the card and first visual as shown in the following screen captures:
-
-
At the bottom of the dialog box, click Save changes. Your new Application Response Time Service Level card displays one visual in your Service Level dashboard.
Next, you can add a second visual to your card.
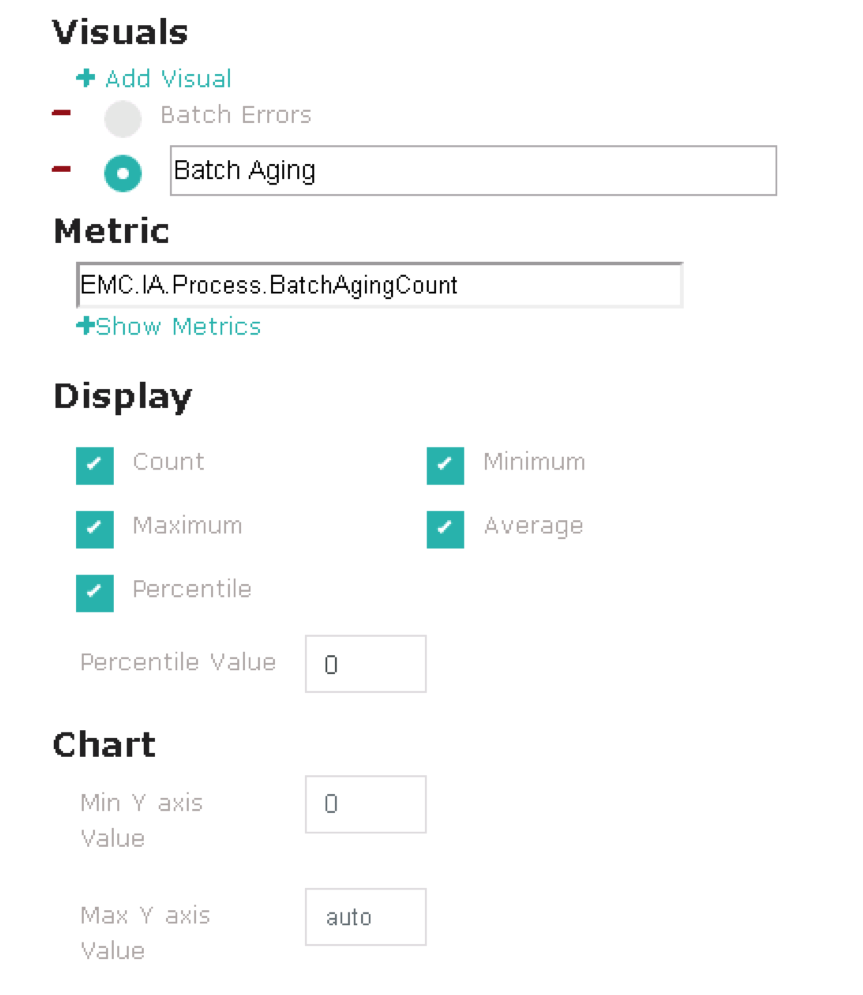
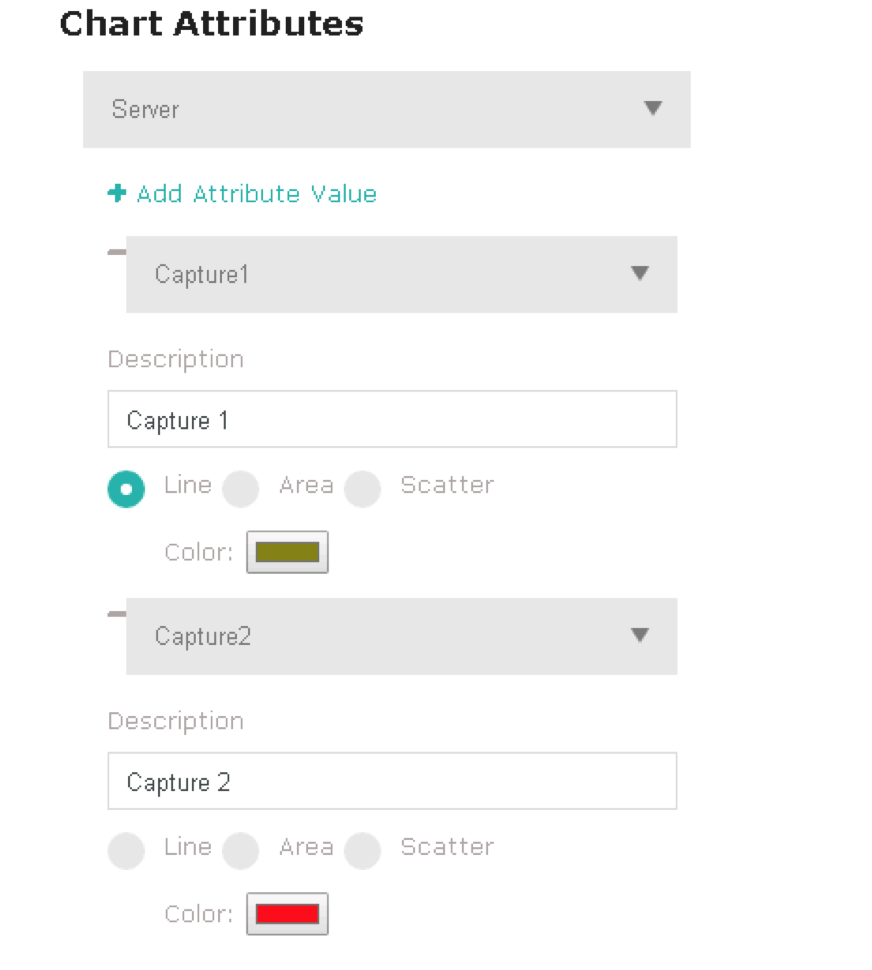
Add the second (Batch Levels) visual to your card
- On the right side of the dashboard, click the gear icon.
- Click Add Visual.
- Configure the second visual as shown in the following screen captures:
-
Click Save changes. Your card displays two visuals in your Capture dashboard.
Next, you can add a third visual to your card.
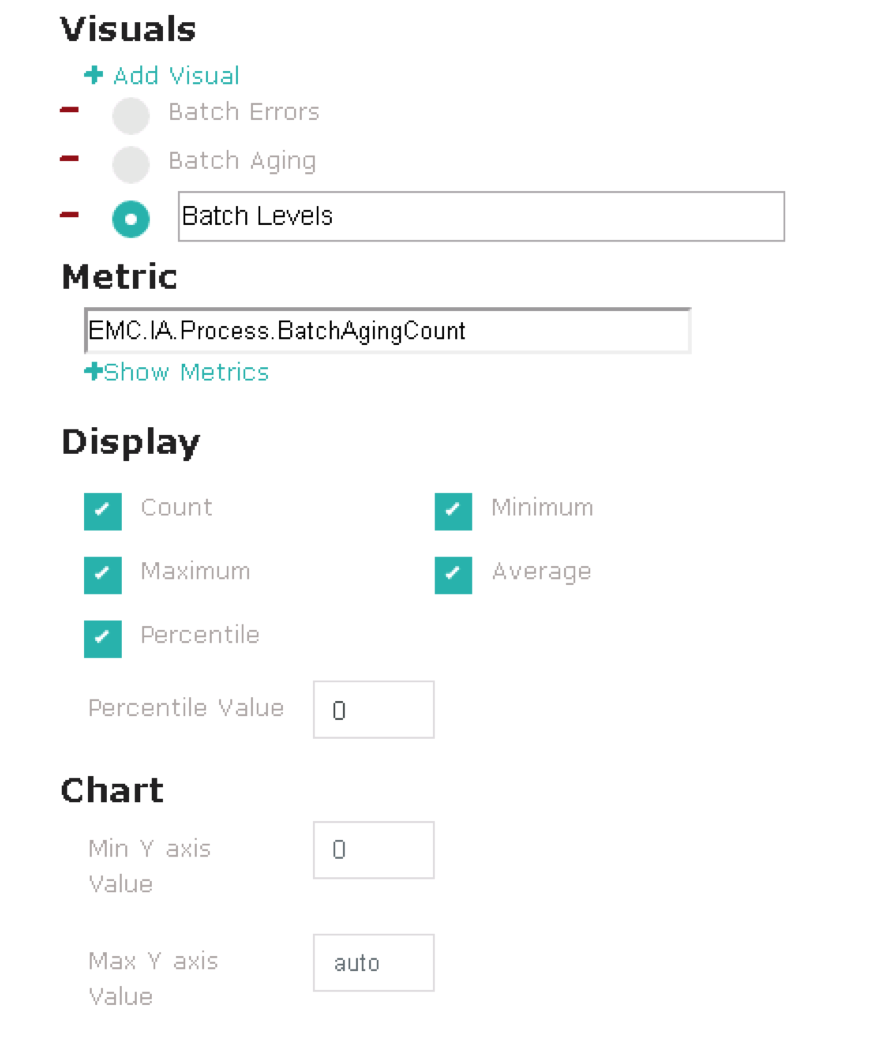
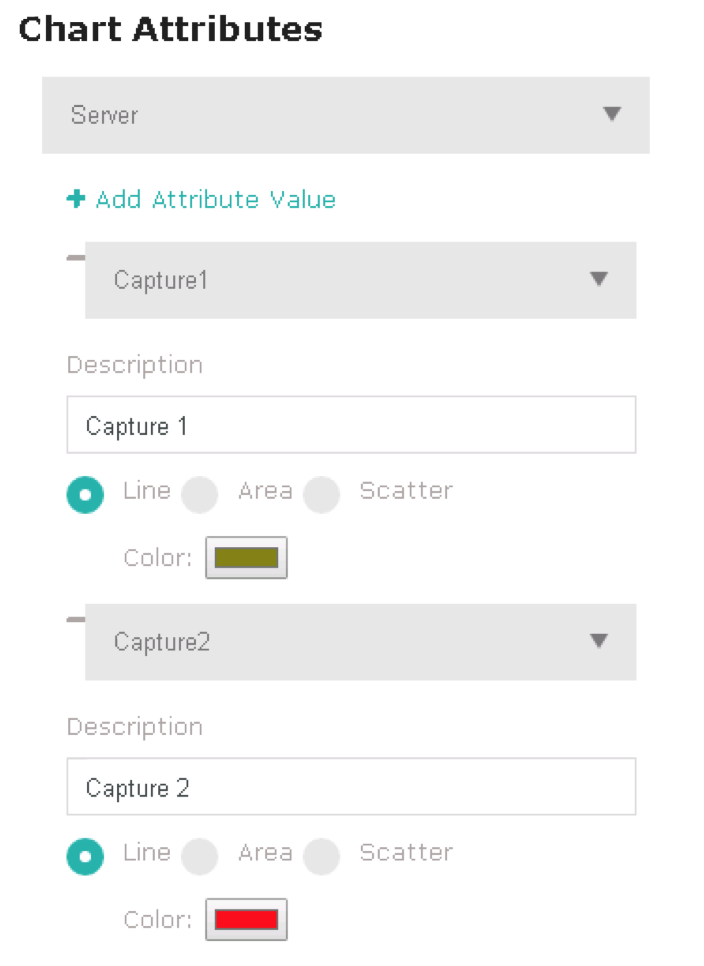
Add the third (Batch Levels) visual to your card
- On the right side of the dashboard, click the gear icon. The Application Response Time Service Level card dialog box opens
- Configure the third visual as shown in the following screen captures:
- Click Save changes. Your new Capture Operations card displays three visuals in your Capture Processing dashboard.
Add the first (Batch Errors) visual to your card

The Application Response Time Service Level card dialog box opens
Was this helpful?
Please tell us why:
Thank you.