Dashboards, cards and visuals
Reveille enables you to pull together information from a wide variety of sources into one web page: different content services platform (CSP) applications, user activities, etc.
The building blocks in Reveille’s user interface are:
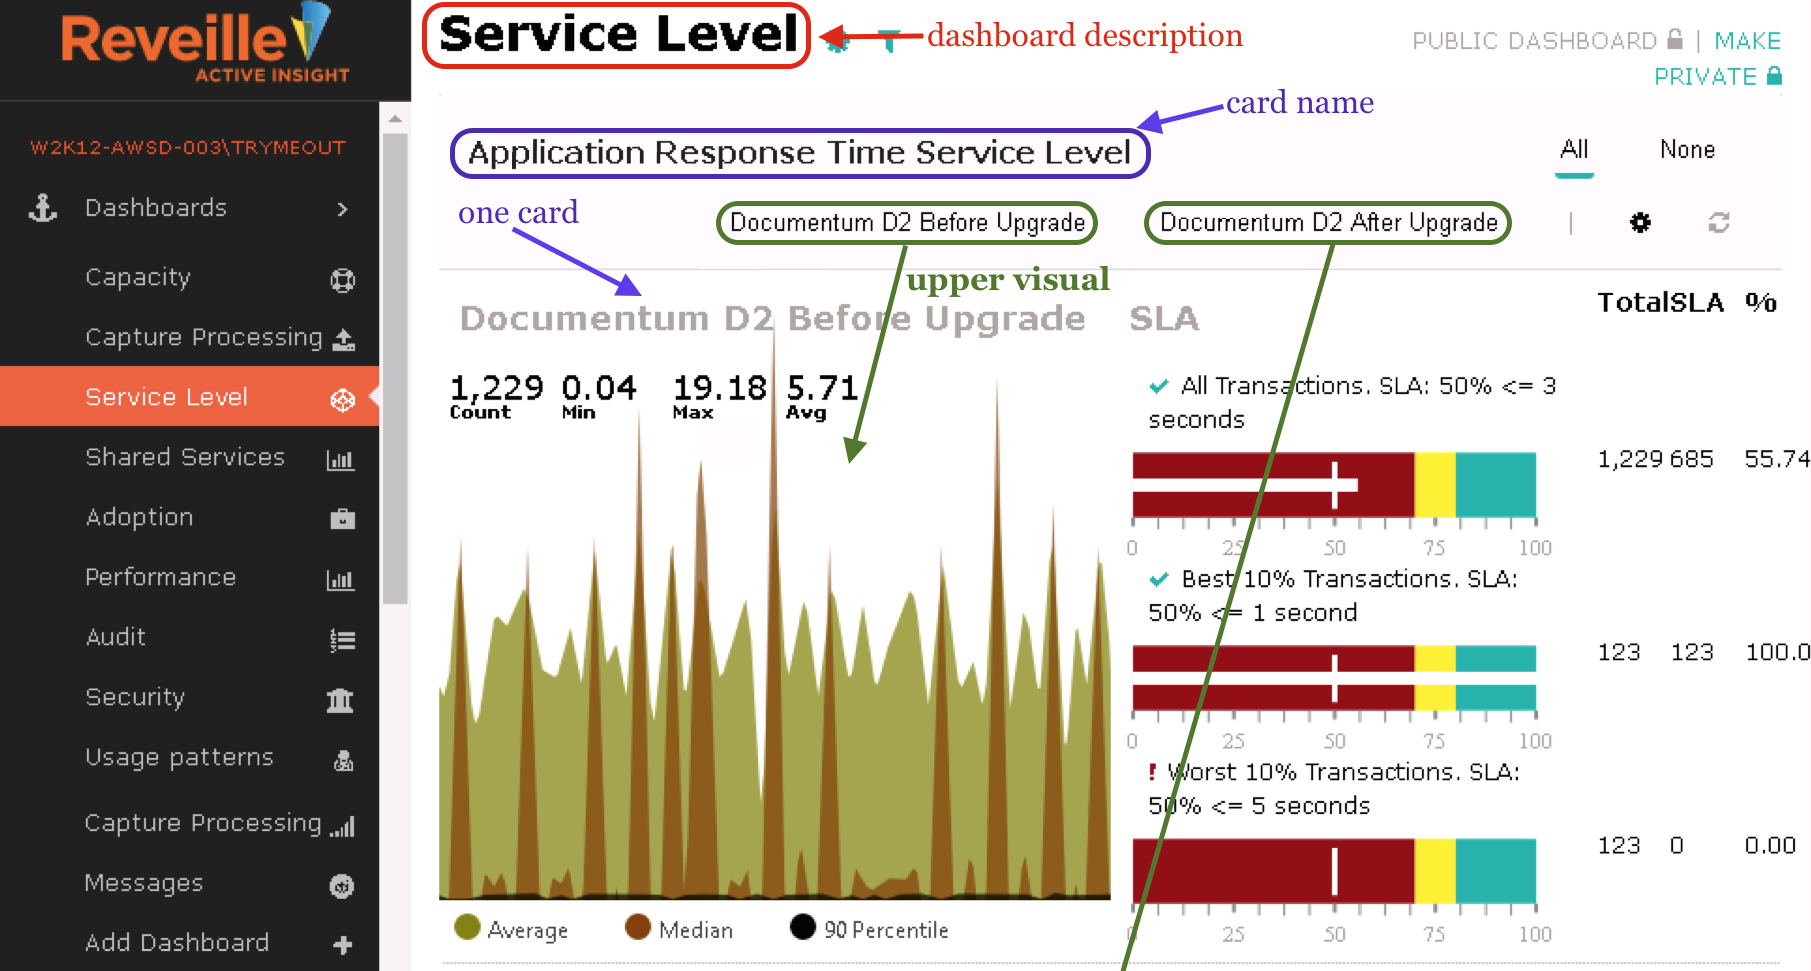
- Dashboards – a dashboard is a collection of graphs, reports, and/or numerical tables organized to present a coherent picture of your content services platform CSP and/or user activities. Generally, you create a Reveille dashboard for a specific area of focus (such as application adoption, or security). A dashboard is made up of one or more cards.
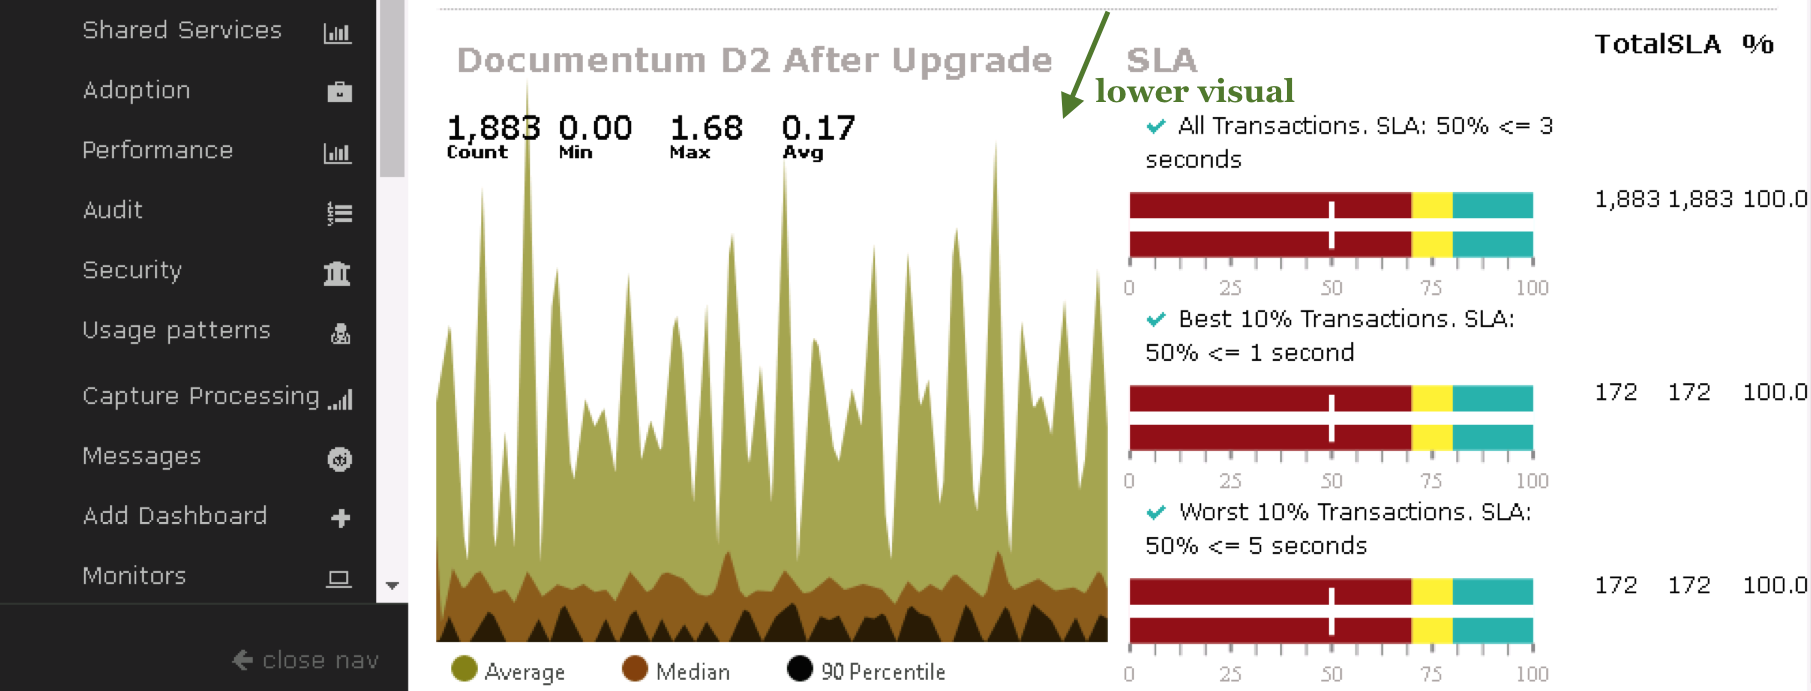
- Cards – a card enables you to arrange graphs, reports, and/or tables into one onscreen presentation within a dashboard. A card has one or more visuals.
- Visuals – a visual is the basic user interface building block. When you configure a visual, you connect it to a data source (such as SharePoint) and metrics, then choose how to present the information in a chart, graph, table or report.
See also Dashboard settings and card settings.
Was this helpful?
Please tell us why:
Thank you.